
Lagrange Multipliers Example 5: 3D Constrained Optimization Visualization
Loading the math board and drawing, please wait…
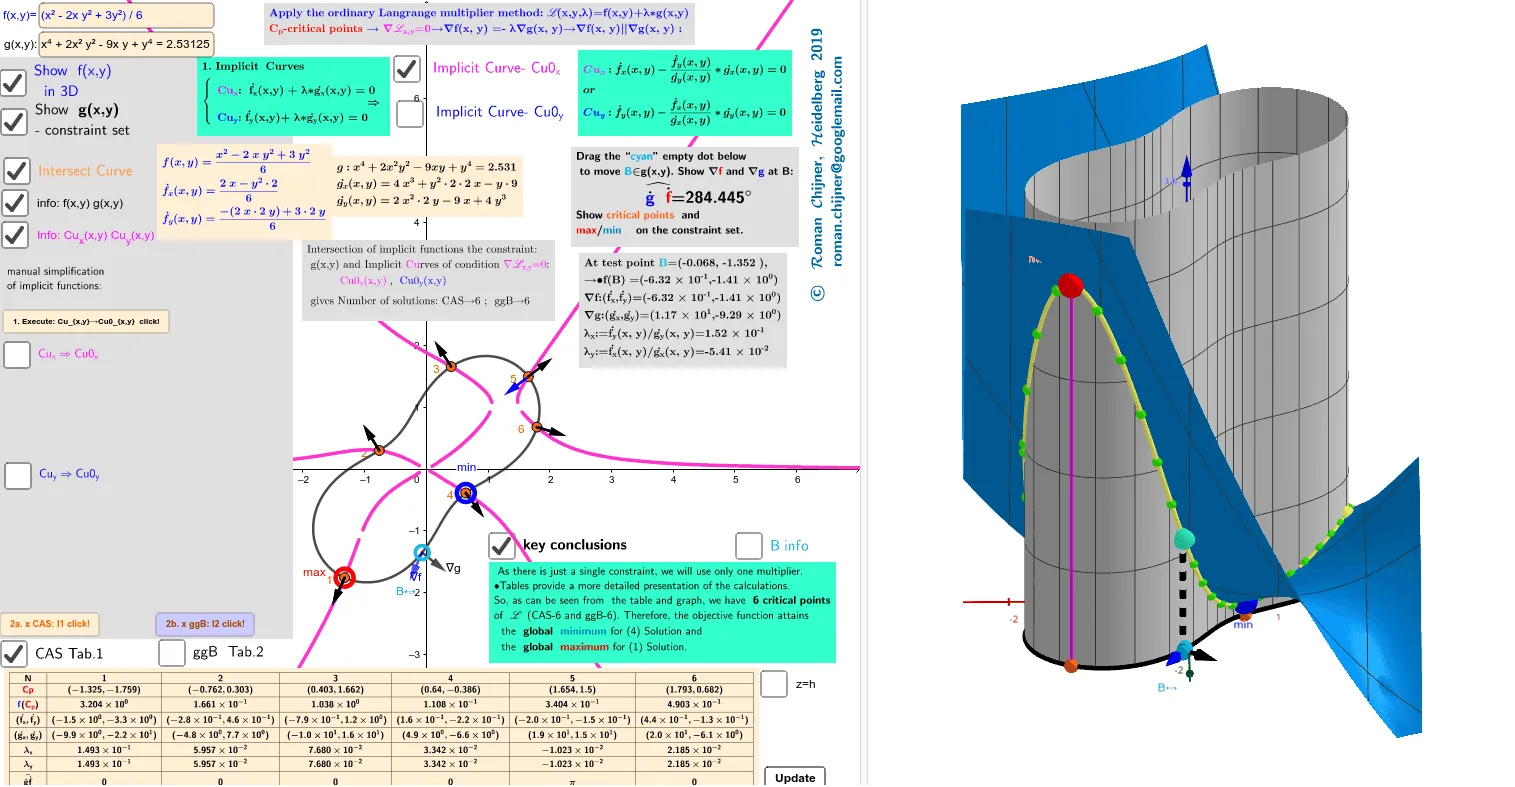
① This example demonstrates the method of Lagrange multipliers for solving constrained optimization problems through a 3D visualization, showing the intersection of the objective function surface and the constraint surface, along with the optimal point. ② Core mathematical concepts include multivariable extrema, constrained optimization, gradient vectors, Lagrange multipliers, and surface-curve intersections. ③ Construction highlights: from the construction summary, Surface and CurveCartesian are used to draw 3D surfaces and curves, Point and Vector mark key points and gradient directions, Angle and Text display angles and labels, Sequence and Zip generate data series, Simplify and LeftSide simplify equations, multiple buttons (button4, button6, etc.) enable interactive control, and LaTeX text and TableText present mathematical formulas. ④ Suitable for university-level calculus or advanced mathematics courses teaching Lagrange multipliers, and also for advanced high school students to explore the geometric meaning of constrained extrema.
GeoGebra Commands & Parameters
Simplify(Derivative[f, y, 1]) → fy'Simplify(Derivative[f, x, 1]) → fx'LeftSide(Cu_g) → gSimplify(Derivative[g, y, 1]) → gy'Simplify(Derivative[g, x, 1]) → gx'Point(Cu_g) → BVector(B, B + UnitVector[Vector[B, Dg]] / 2) → u_gVector(B, B + UnitVector[Vector[B, Df]] / 2) → u_fAngle(u_g, u_f) → αLaTeX(f, true) → text8aLaTeX(Cu_g, true) → text8bTextfield(f) → InputBox3Textfield(Cu_g) → InputBox4Zip((x(a), y(a), f(a)), a, Sequence[Point[Cu_g, t / n], t, 0, n]) → lg_1Textfield(n) → InputBox5Element(l1, Indexmax1) → Amax1Element(l1, Indexmin1) → Amin1Element(l1f, Indexmax1) → Amax1_{3D}Element(l1f, Indexmin1) → Amin1_{3D}Element(l2f, Indexmin2) → Amin2_{3D}LaTeX(Amin2_{3D}, true, true) → text17Surface((-4.4 * cos(t)), sqrt(1 - cos(t)^(2)), u, t, (-π), π, u, -5, 60) → g1aSurface((-4.4 * cos(t)), (-sqrt(1 - cos(t)^(2))), u, t, (-π), π, u, -5, 60) → g2aCurveCartesian((-sqrt(t)), sqrt((1 - t^(3)) / 3), f((-sqrt(t)), sqrt((1 - t^(3)) / 3)), t, 0, 1) → q2Surface((-(1 - (3 * t^(2)))^(1 / 6)), t, u, t, -1 / sqrt(3), 1 / sqrt(3), u, -1.2, 1.2) → g2CurveCartesian((-sqrt(t)), (-sqrt((1 - t^(3)) / 3)), f((-sqrt(t)), (-sqrt((1 - t^(3)) / 3))), t, 0, 1) → q1aCurveCartesian(sqrt(t), (-sqrt((1 - t^(3)) / 3)), f(sqrt(t), (-sqrt((1 - t^(3)) / 3))), t, 0, 1) → q2aCurveCartesian((rr(t) * cos(t / 2)), (rr(t) * sin(t / 2)), f((rr(t) * cos(t / 2)), (rr(t) * sin(t / 2))), t, 0, 12) → q1Surface((rr(t) * cos(t / 2)), (rr(t) * sin(t / 2)), v, t, 0, (4 * π), v, 0, 4) → g1RotateText(text1, 90°) → text3TableText(Append["N", 1…Length[l1]], Append["\fgcolor{red}{Cp}", l1], Append["\fgcolor{blue}{f}(\fgcolor{red}{C_p })", l1fa], Append["(\dot{f_x},\dot{f_y})", l1xy'_fa], Append["(\dot{g_x},\dot{g_y})", l1xy'_ga], Append["λ_x", lλ1ax], Append["λ_y", lλ1ay], Append["\widehat{\dot{g}\dot{f}} ", lα1], "c|_") → tTab1TableText(Append["N", 1…Length[l2]], Append["\fgcolor{red}{Cp}", l2], Append["\fgcolor{blue}{f}(\fgcolor{red}{C_p })", l2fa], Append["(\dot{f_x},\dot{f_y})", l2xy'_fa], Append["(\dot{g_x},\dot{g_y})", l2xy'_ga], Append["λ_x", lλ2ax], Append["λ_y", lλ2ay], Append["\widehat{\dot{g}\dot{f}} ", lα2], "c|_") → tTab2Segment(B, C) → f_1Text("∇g", Point[u_g, 1]) → text25gText("∇f", Point[u_f, 1]) → text25fElement(l2, Indexmax2) → Amax2Element(l2f, Indexmax2) → Amax2_{3D}Element(l2, Indexmin2) → Amin2Simplify(fx'(x, y) - (gx'(x, y) * fy'(x, y) / gy'(x, y))) → Cu_xfSimplify(fy'(x, y) - (gy'(x, y) * fx'(x, y) / gx'(x, y))) → Cu_yfRemoveUndefined(Zip[Vector[c, c + UnitVector[a] / 2], a, l1xy'_f, c, l1]) → lvec1_fRemoveUndefined(Zip[Vector[c, c + UnitVector[a] / 2], a, l1xy'_g, c, l1]) → lvec1_gRemoveUndefined(Zip[Vector[c, c + UnitVector[a] / 2], a, l2xy'_f, c, l2]) → lvec2_fRemoveUndefined(Zip[Vector[c, c + UnitVector[a] / 2], a, l2xy'_g, c, l2]) → lvec2_gTextfield(txtCu01_x) → InputBox1Textfield(txtCu01_y) → InputBox2Zip(Segment[a, b], a, l1, b, l1f) → l1segSequence(Text[i, l1(i) - (0.3, 0.1)], i, 1, lä1) → l1txtSequence(Text[i, l2(i) - (0.3, 0.1)], i, 1, lä2) → l2txtZip(Segment[a, b], a, l2, b, l2f) → l2seg
AI Drawing Prompt Reference
Draw a 3D visualization of a constrained optimization problem, including the intersection of the objective function surface and the constraint surface, as well as the gradient vectors at the optimal point. Start by drawing the objective function surface, then draw the constraint surface, find their intersection and mark the optimal point. Finally, draw the gradient vectors of the objective and constraint functions at the optimal point and calculate the angle between them.
The prompt above was compiled from the original drawing commands and is for reference only.