
Key Features of Trigonometric Graphs (Part 1)
Loading the math board and drawing, please wait…
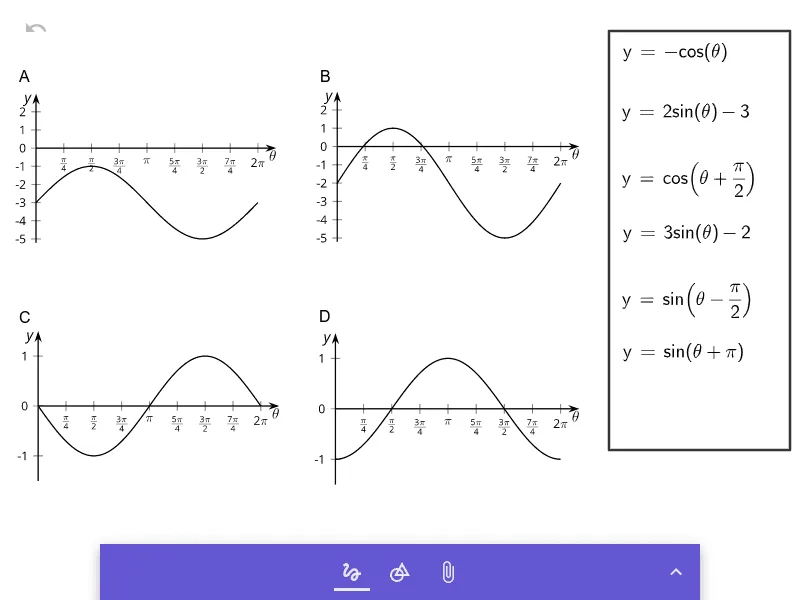
This GeoGebra lesson example demonstrates the main geometric features of trigonometric function graphs and how they change under parameter variations. The central math concepts include periodicity, amplitude, midline shifts, phase changes, and frequency effects (how the wave stretches/compresses horizontally). It focuses on interpreting the curve within one period and relating notable points and bounds to parameters in models such as y = A·sin(B(x−C)) + D or y = A·cos(B(x−C)) + D. Construction-wise, the provided construction summary is empty, so the typical implementation relies on defining the trigonometric function with parameters and graphing it in GeoGebra, then visualizing how A, B, C, and D affect amplitude, cycle length, horizontal positioning, and vertical shift—often using interactive inputs (e.g., sliders) to compare outcomes. Suitable for middle/high school function instruction and for early university precalculus/trigonometry graphing practice.
AI Drawing Prompt Reference
Draw a graph of a sine or cosine function with sliders for parameters A, B, C, and D, showing how changes in these parameters affect the amplitude, period, horizontal shift, and vertical shift of the graph. Mark the maximum, minimum, and x-intercept points within one period and illustrate the relationship between these points and the parameters.
The prompt above was compiled from the original drawing commands and is for reference only.