
Joint Bar Graph
Loading the math board and drawing, please wait…
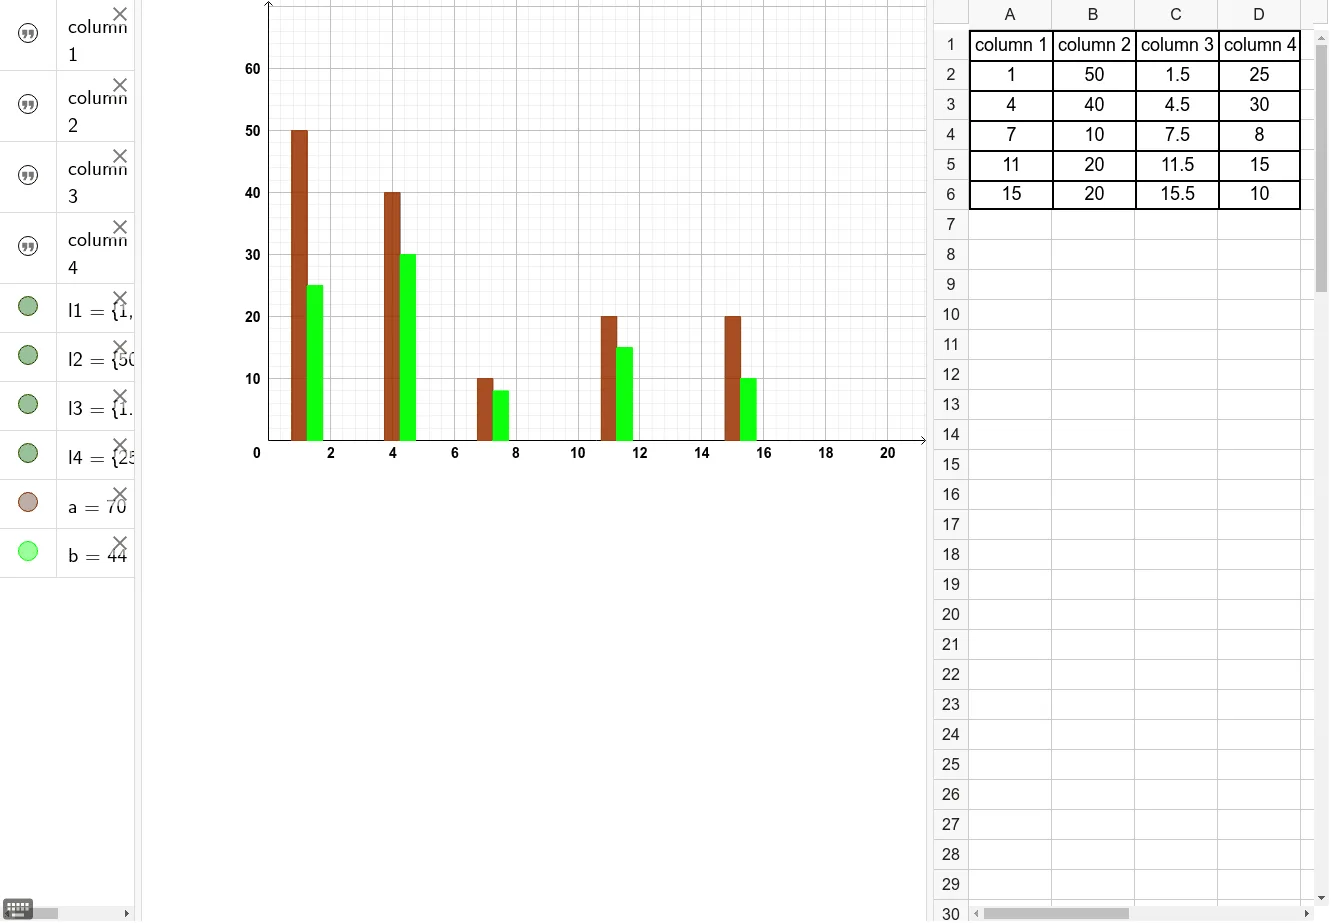
This example demonstrates the construction of a joint bar graph. It involves statistical data comparison and analysis. Using GeoGebra commands such as BarChart, users can easily create multiple bar graphs for comparison. This example is suitable for middle school and above students or teachers for teaching and learning.
GeoGebra Commands & Parameters
BarChart(l1, l2, 0.5) → aBarChart(l3, l4, 0.5) → b
AI Drawing Prompt Reference
Create a joint bar graph comparing two sets of data. Use light gray fill, each bar group contains four bars, with spaces between each bar, and half the total width for each bar. Ensure clear spacing between bar groups for a distinct comparison effect.
The prompt above was compiled from the original drawing commands and is for reference only.