
Investigating the Effect of Mean and Variance on Normal Curve
Loading the math board and drawing, please wait…
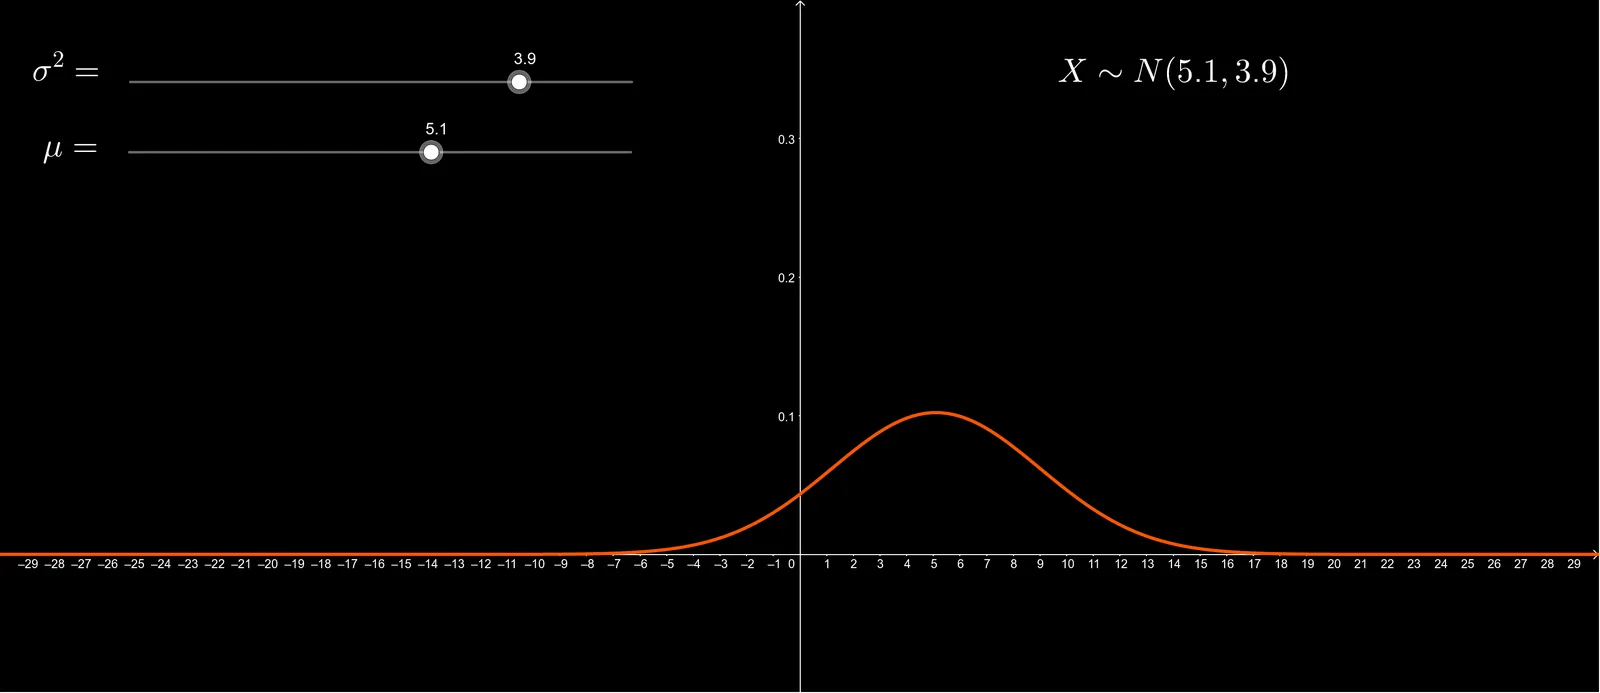
This example demonstrates the impact of mean and variance on the shape and position of a normal curve by adjusting these parameters. Key mathematical concepts include normal distribution, variance, and mean. GeoGebra commands used include g, s, m, f, text1, text2, and text3. Suitable for high school and above students or teachers.
GeoGebra Commands & Parameters
g(x) = (1 / sqrt((2 * π)) * ℯ^(((-x^(2))) / 2))Numeric s(3.9)Numeric m(5.1)f(x) = (1 / sqrt(((2 * π) * s^(2))) * ℯ^(((-(x - m)^(2))) / ((2 * s^(2)))))
AI Drawing Prompt Reference
Draw a standard normal distribution curve with mean 0 and variance 1. Then draw another normal distribution curve with mean 5.1 and standard deviation 3.9. Both curves share the same x-axis and y-axis, showing how the mean shifts the curve horizontally and the variance changes its height and spread. The curves should be smooth and continuous, with approximate peak positions indicated.
The prompt above was compiled from the original drawing commands and is for reference only.