
Drag and Drop Points to Create Histogram
Loading the math board and drawing, please wait…
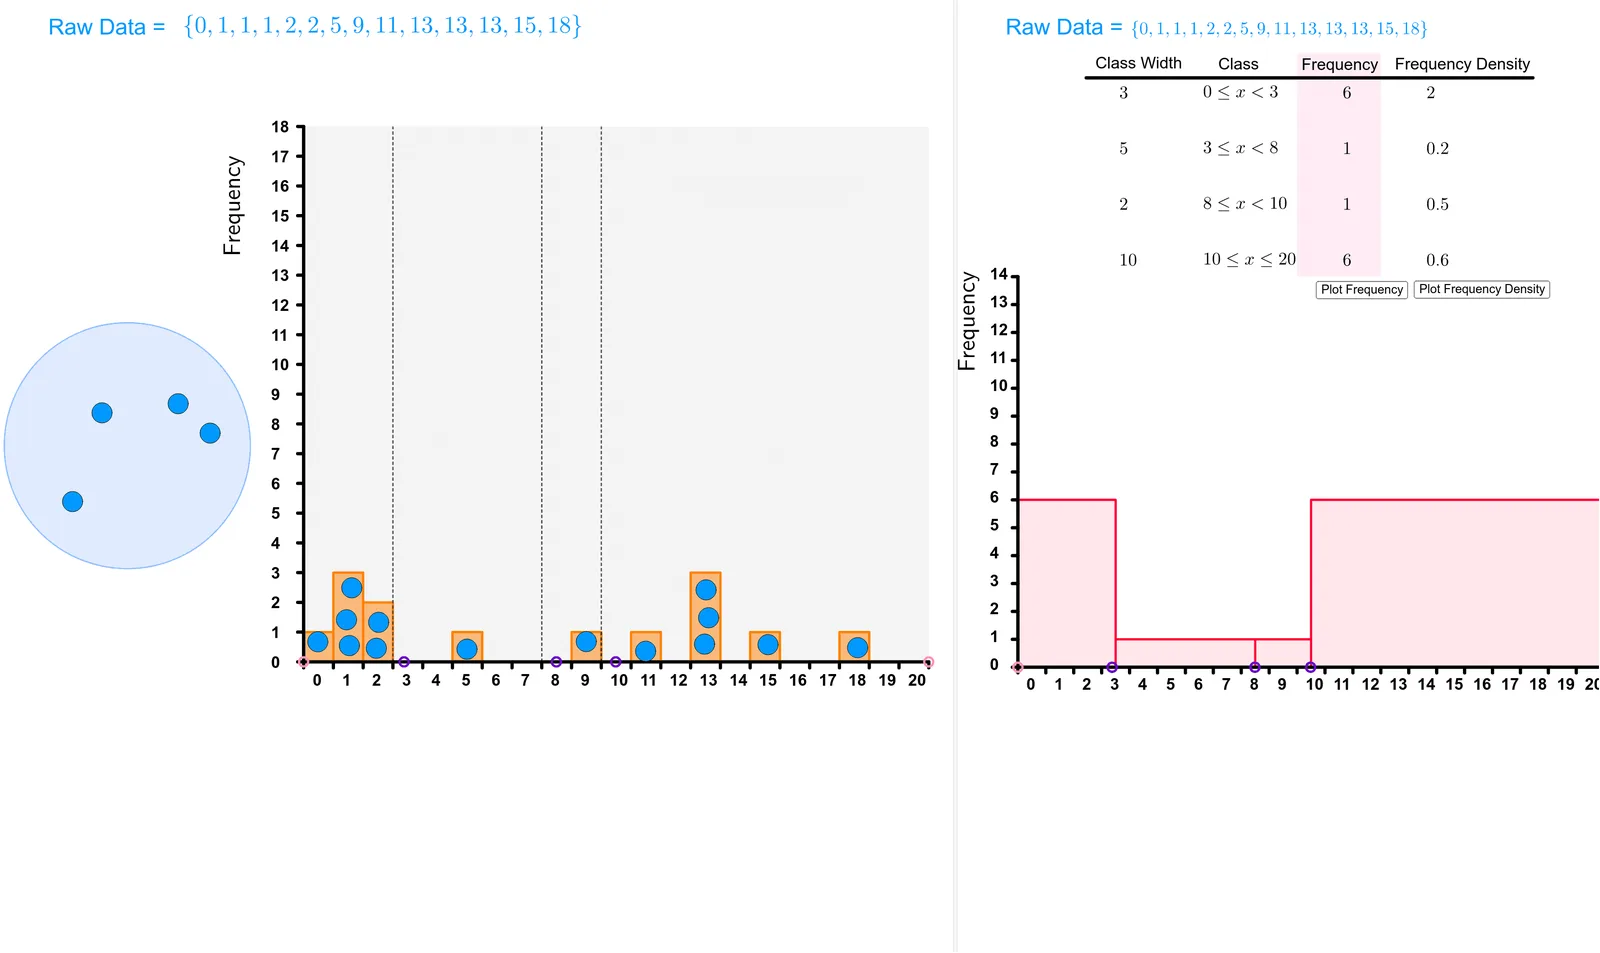
This example demonstrates how to create a histogram by dragging points. Key mathematical concepts include histogram construction, area calculation, and the use of line segments. Using GeoGebra commands such as Polygon, Segment, and Histogram, it dynamically shows data distribution. Suitable for high school students and teachers for teaching and learning probability and statistics.
GeoGebra Commands & Parameters
Polygon(A, B, C, D) → Region, a, b, c, dSegment(A, D) → NumberlineCircle(W, Z) → HoldingPenRemoveUndefined(Sort[AllPoints]) → PointsInRegionSequence(Text[i, (i - 0.2, -0.8)], i, 0, 20, 1) → TicksTextHistogram({-0.5, 0.5, 1.5, 2.5, 3.5, 4.5, 5.5, 6.5, 7.5, 8.5, 9.5, 10.5, 11.5, 12.5, 13.5, 14.5, 15.5, 16.5, 17.5, 18.5, 19.5, 20.5}, PointsInRegion) → histogramSegment(A_1, B_1) → fFrequency({-1, x2}, PointsInRegion) → f1listFrequency({x2, x3}, PointsInRegion) → f2listFrequency({x3, x4}, PointsInRegion) → f3listFrequency({x4, 20.5}, PointsInRegion) → f4listElement(f1list, 1) → f1Element(f2list, 1) → f2Element(f3list, 1) → f3Element(f4list, 1) → f4Histogram({-0.5, x2, x3, x4, 20.5}, {d1, d2, d3, d4}) → FreqDensHistSequence(Segment[(i, 0), (i, -0.2)], i, -0.5, 20.5) → TicksLaTeX(text10, true, true) → text23Segment(A, (-0.5, 18)) → jSequence(Text[i, (-1.6, i - 0.2)], i, 0, 18) → l3Sequence(Segment[(-0.7, i), (-0.5, i)], i, 0, 18) → l4RotateText(text24, 90°) → text25RotateText("Frequency Density", 90°) → text26Histogram({-0.5, x2, x3, x4, 20.5}, {f1, f2, f3, f4}) → FreqHistRotateText("Frequency", 90°) → text27Segment(A, (-0.5, 14)) → FreqDensLineSequence(Text[i, (-1.5, i - 0.1)], i, 0, 14) → l1Sequence(Segment[(-0.7, i), (-0.5, i)], i, 0, 14) → l2Polygon(C_1, D_1, E_1, F_1) → q1, c_1, d_1, e_1, f_1Polygon(G_1, H_1, I_1, J_1) → q2, g_1, h_1, i_1, j_1Segment((x2 - 0.5, 0), (x2 - 0.5, 18)) → iSegment((x3 - 0.5, 0), (x3 - 0.5, 18)) → kSegment((x4 - 0.5, 0), (x4 - 0.5, 18)) → l
AI Drawing Prompt Reference
Create a histogram by dragging points. First, draw a rectangle formed by four points, then generate some points within this region. Calculate the frequency for each interval based on the positions of these points and represent them as rectangles. Add horizontal line segments as ticks at the bottom of the histogram and label them with frequency density and frequency. Finally, divide the histogram into four parts, each with a different color, and add a title at the top.
The prompt above was compiled from the original drawing commands and is for reference only.