
Investigating Sine Functions and Sound Waves Through Graphing
Loading the math board and drawing, please wait…
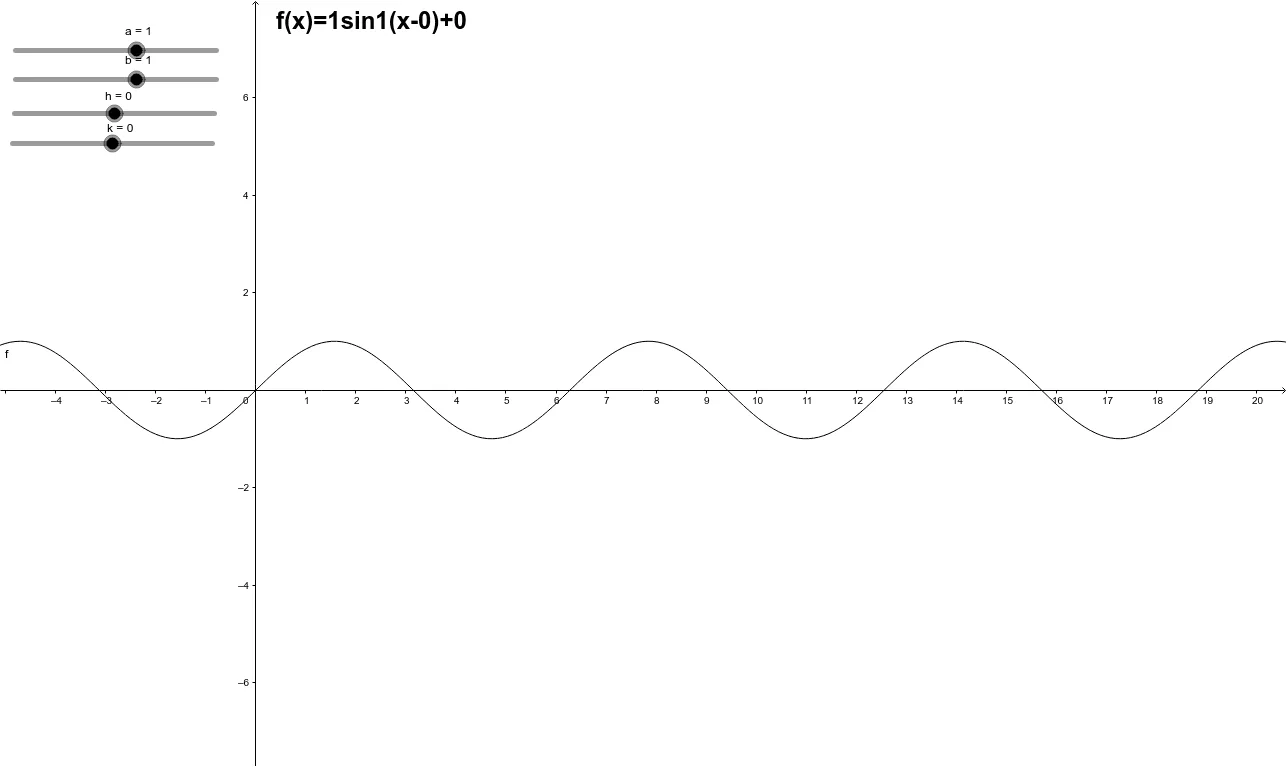
This GeoGebra example helps students discover how to graph a sine wave and how changing key parameters reshapes the wave, making the “sound wave” idea visually intuitive. It focuses on sine functions as mathematical models for periodic oscillations. Students work with core concepts such as amplitude, period (frequency relationship), phase or horizontal shifts, vertical shifts, and how these parameters translate directly into recognizable changes on the graph. Construction uses the provided objects a, b, h, k, f, and text1 to represent parameters and the resulting function definition f, then labels/annotates the scene using text1 so learners can connect parameter changes to graph behavior. Suitable for secondary school through early university learners, especially for interactive lessons on trigonometry and function graphing.
GeoGebra Commands & Parameters
Numeric a(1.0)Numeric b(1.0)Numeric h(0.0)Numeric k(0.0)f(x) = (a * sin((b * (x - h)))) + k
AI Drawing Prompt Reference
Draw a graph for investigating a parameterized sine function. Include adjustable parameters a, b, h, and k, and define the curve as f(x) = (a * sin(b * (x - h))) + k. Indicate in a simple text annotation how a relates to amplitude, b to period/frequency, h to horizontal shift, and k to vertical shift. Construct and display the resulting sine wave in one coordinate system so viewers can visually connect changes in these parameters to the reshaping of the wave.
The prompt above was compiled from the original drawing commands and is for reference only.