
Investigating Inequalities
Loading the math board and drawing, please wait…
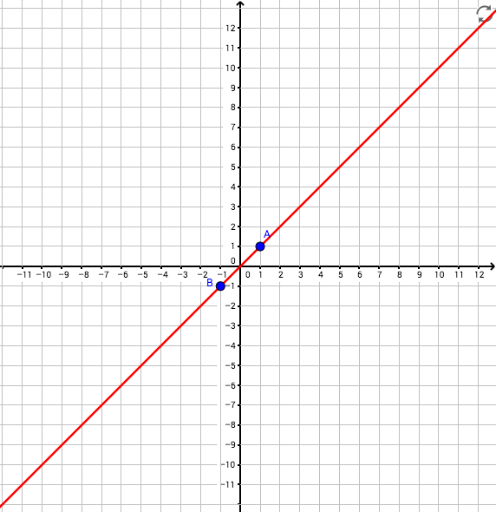
This example demonstrates the graphical representation of systems of inequalities and their solution regions. Key math concepts include inequalities, region visualization, and linear programming. It uses GeoGebra commands like Random, RandomPolynomial, Element, Line, and If. Suitable for high school mathematics students or probability & statistics education.
GeoGebra Commands & Parameters
Random(1, 4) → aRandom(1, 4) → bRandomPolynomial(1, -10, 10) → pRandomPolynomial(1, -10, 10) → hElement(list1, a) → cElement(list2, b) → eLine(F, G) → lLine(F, G) → mIf(i ≟ 0 ∧ (a < 3) ∨ i ≟ 1 ∧ (a > 2), 1, 0) → nIf(n ≟ 1 ∧ l ≟ h, 1, 0) → oIf(j ≟ 0 ∧ (b < 3) ∨ j ≟ 1 ∧ (b > 2), 1, 0) → s