
Investigating Domain and Range of Quadratic Functions
Loading the math board and drawing, please wait…
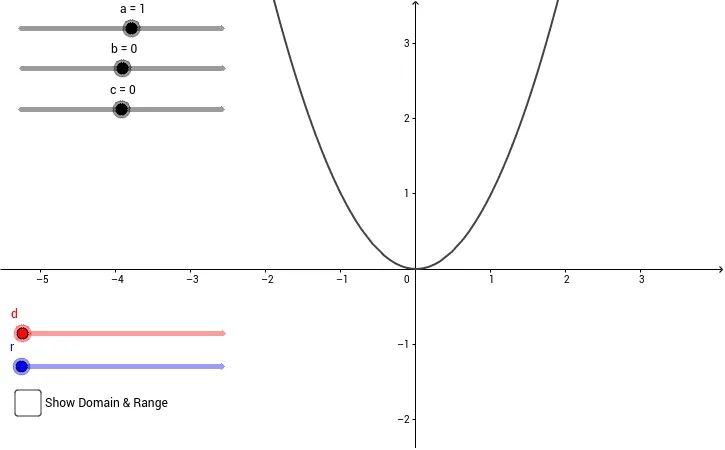
This applet demonstrates how to investigate the domain and range of a quadratic function of the form f(x)=ax^2+bx+c using GeoGebra. Sliders are provided to adjust parameters a, b, and c, allowing users to observe changes in the function's graph and its domain (always all real numbers) and range (dependent on the sign of a and the direction of the parabola's opening). Key math concepts include quadratic functions, domain, range, and function graph transformations. Construction highlights the use of GeoGebra commands/objects like Segment, If, objects c, b, a, f, d, dtracer, text1, domain, r, e, rtracer, range, D. Suitable for high school mathematics education to help students visually understand the properties of quadratic functions and how parameters affect their graphs.
GeoGebra Commands & Parameters
Segment((-10, 0), (d, 0)) → domainIf(e, (0, f(d)), (0, f(r))) → rtracerIf(e, Segment[(0, f(-10)), (0, f(d))], Segment[(0, f(-10)), (0, f(r))]) → rangeIf(e, If[d ≟ round(((-b)) / ((2 * a))), (0, f(((-b)) / ((2 * a))))], If[r ≟ round(((-b)) / ((2 * a))), (0, f(((-b)) / ((2 * a))))]) → D