
Inverse Proportion
Loading the math board and drawing, please wait…
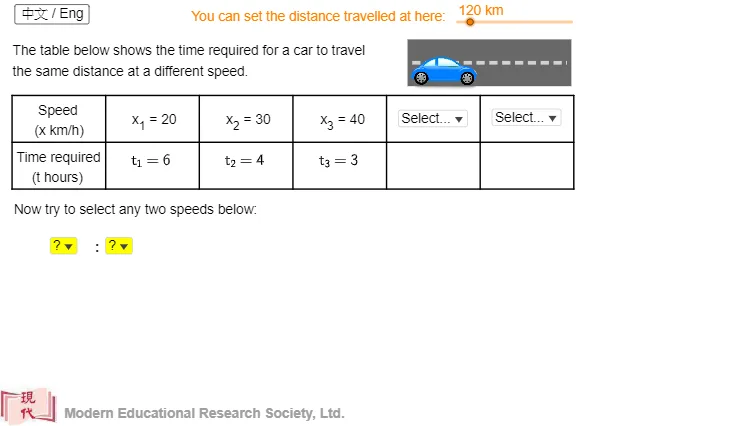
This example illustrates the graph of inverse proportion. Inverse proportion is a special type of function where the product of two variables is a constant. Using GeoGebra commands such as Corner, If, Sequence, Polygon, etc., the graph and properties of the inverse proportion function can be visually demonstrated. Suitable for students at the junior high school level and above to learn about the concept and graph characteristics of inverse proportion functions.
GeoGebra Commands & Parameters
Corner(1, 1) → ZIf(chi ≟ false, "Try again.", "請再嘗試") → text28If(chi ≟ false, "Correct", "正確") → text29If(chi ≟ false, "Incorrect. Please try again.", "答案錯誤,請再試嘗試。") → text33Sequence(Segment[(x(A) + (2 * i), y(A)), (x(A) + (2 * i), y(A) - 2)], i, 0, 6) → l1Sequence(Segment[(x(A), y(A) - i), (x(A) + 12, y(A) - i)], i, 0, 2) → l2If(chi ≟ false, "Select...", "請選擇...") → text49If(chi ≟ false, "Yes", "是") → text47If(chi ≟ false, "No", "否") → text48Polygon(B, (x(B) + 3.5, y(B)), (x(B) + 3.5, y(B) + 1), (x(B), y(B) + 1)) → q1, f, g, h, iSegment((x(B) + 0.1, y(B) + 0.5), (x(B) + 3.4, y(B) + 0.5)) → j
AI Drawing Prompt Reference
Draw the graph of an inverse proportion function using points A and B, where A is at (1,1) and B is at (2,0.5). Use segments and a polygon to assist in the display, including horizontal and vertical segments from point A, and a rectangle surrounding point B. Ensure the graph shows the relationship between points A and B, as well as the positions of the auxiliary lines and the rectangle.
The prompt above was compiled from the original drawing commands and is for reference only.