
Inverse Functions & Derivatives (Using e and ln)
Loading the math board and drawing, please wait…
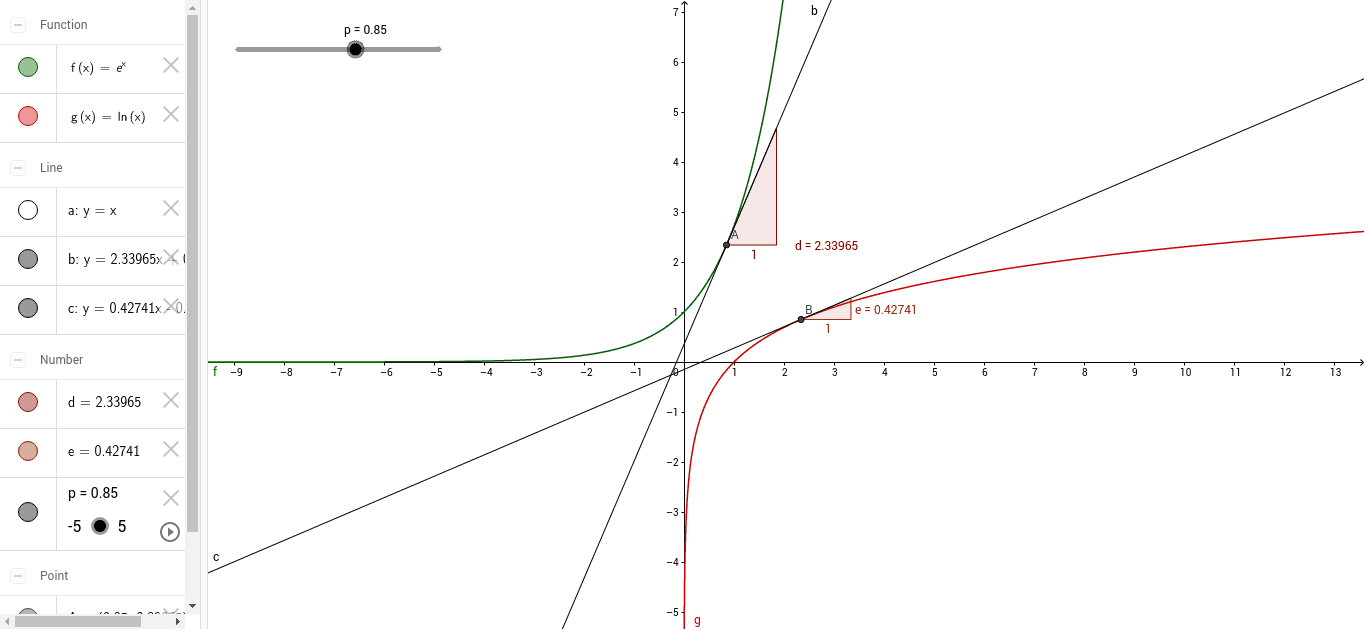
This GeoGebra example demonstrates the intricate relationship between inverse functions and derivatives, with a focus on the natural exponential function e^x and the natural logarithm function ln(x). It provides a visual exploration of how the derivative of a function relates to its inverse, highlighting key concepts such as the inverse function theorem, differentiation rules for logarithmic and exponential functions, and the unique properties of the base e. The construction leverages GeoGebra commands like Tangent to draw tangent lines for visualizing derivatives geometrically, and Slope to compute slopes at points for interactive analysis. Objects involved include functions f, a, g, p, A, b, B, c, d, e, which work together to create a dynamic model illustrating symmetry and rate of change. This resource is ideal for high school or college calculus courses, serving as an educational tool to deepen understanding of inverse functions and derivatives through graphical and computational approaches.
GeoGebra Commands & Parameters
Tangent(A, f) → bTangent(B, g) → cSlope(b) → dSlope(c) → e
AI Drawing Prompt Reference
Draw a graph showing the relationship between the exponential function e^x and its inverse ln(x). Include function curves, tangent lines, and slopes of these tangents. Tangent lines help visualize derivatives, while slopes illustrate rates of change. The graph should highlight symmetry and rate of change, suitable for learning about inverse functions and derivatives.
The prompt above was compiled from the original drawing commands and is for reference only.