
Limits & Tables II
Loading the math board and drawing, please wait…
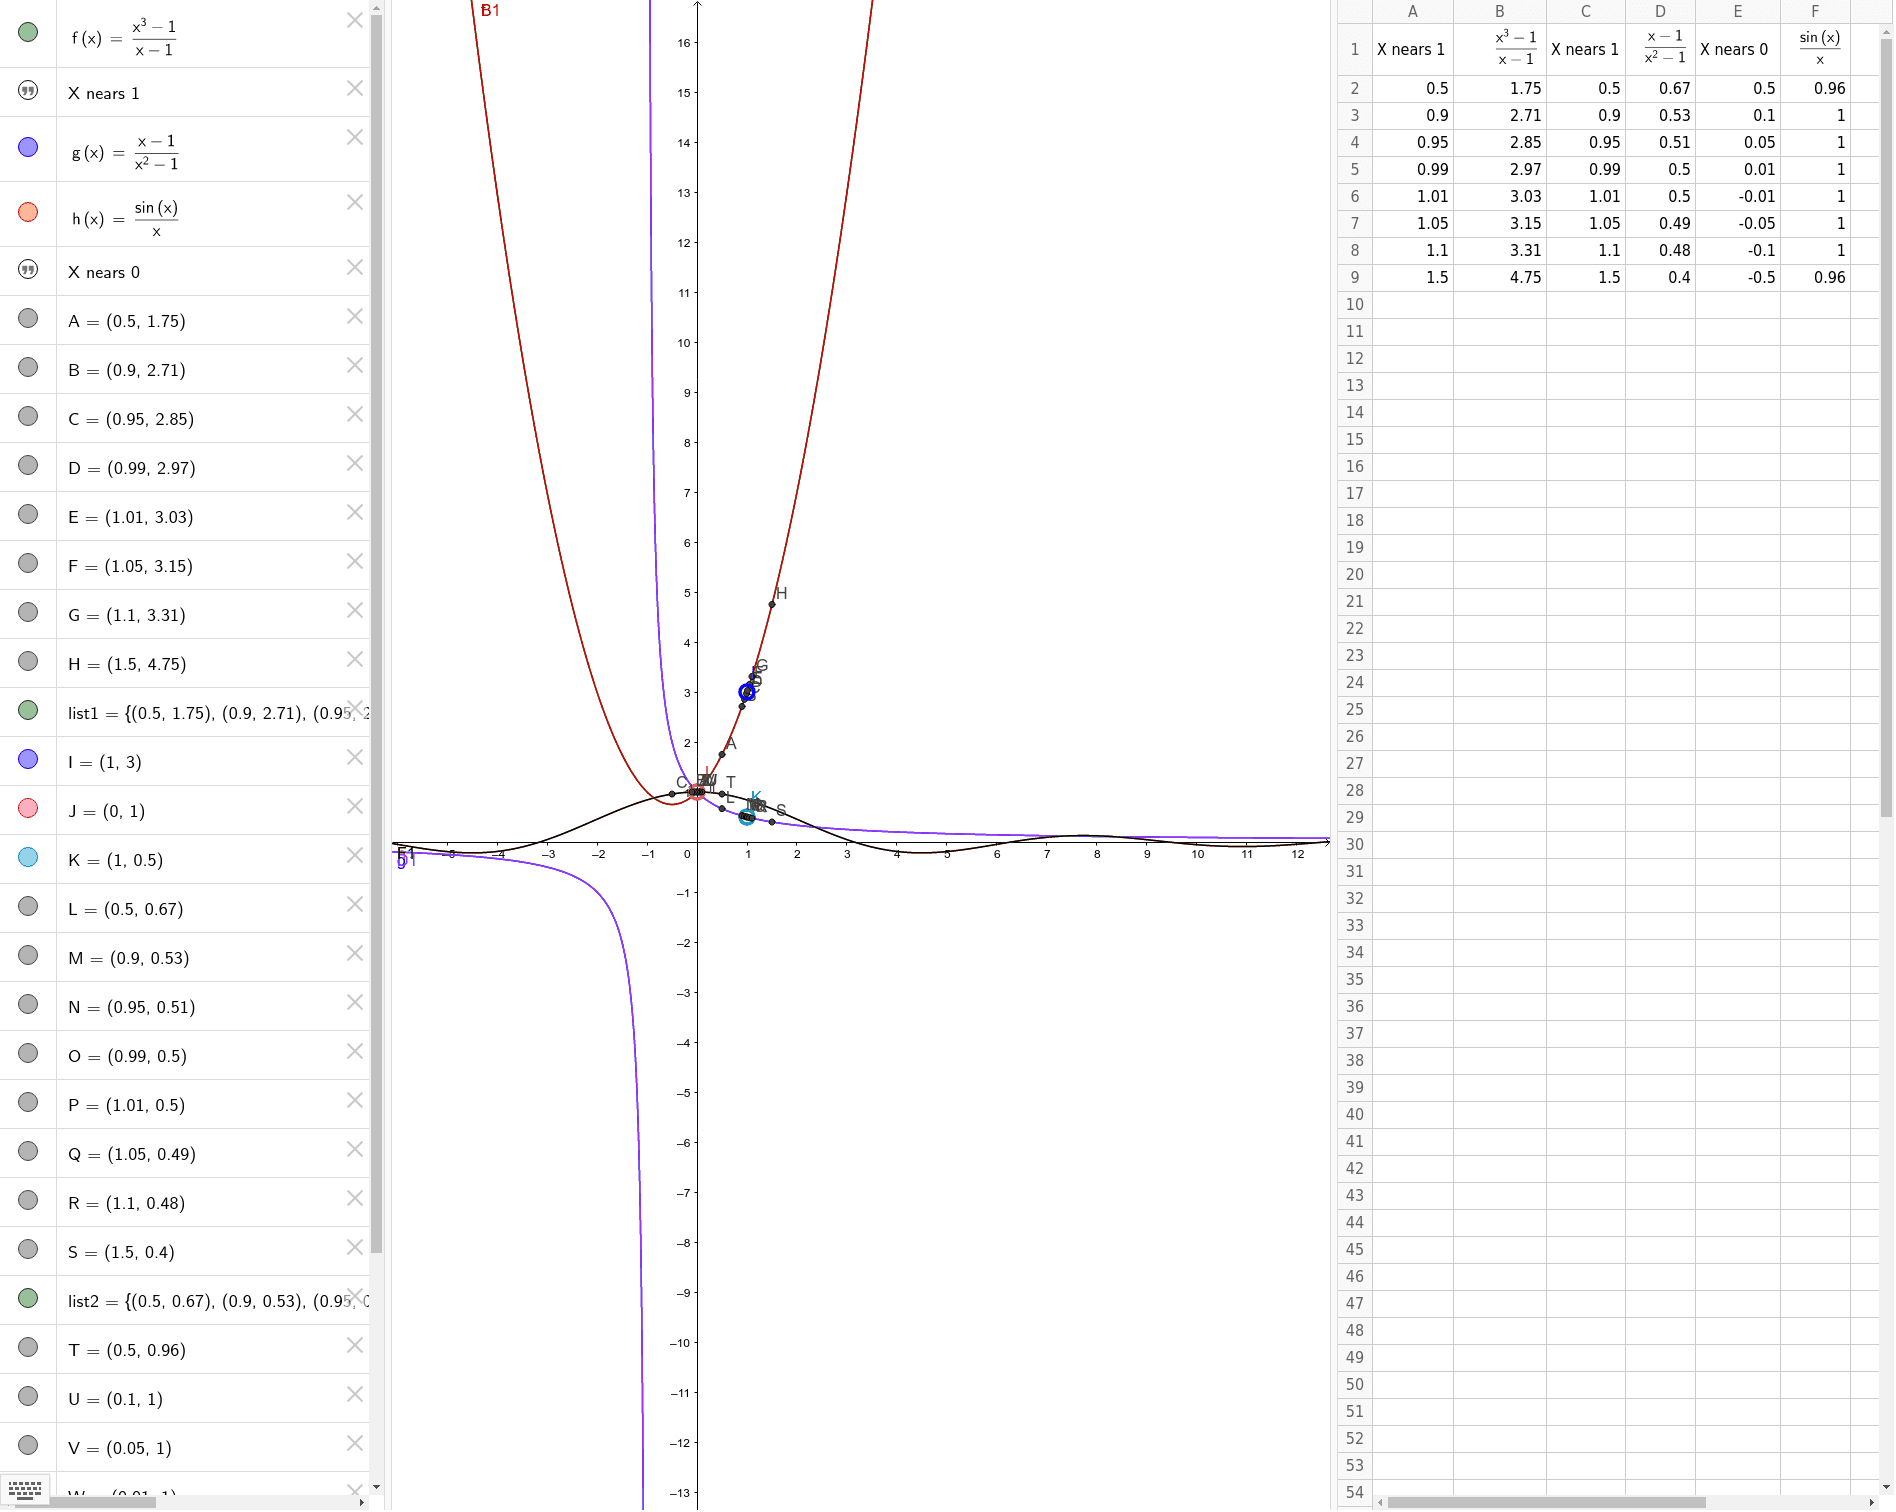
This example demonstrates the concept and calculation of function limits through dynamic tables and graphs. It involves core math concepts like limits, numerical analysis, distributions, scatter plots, and integral calculus. Constructed using GeoGebra commands like objects f, g, h, and a series of A, B, C, D, E objects for function definition, data generation, and graphical plotting. Suitable for high school and above students learning limit theory and its applications.
GeoGebra Commands & Parameters
f(x) = (x^(3) - 1) / (x - 1)Numeric A2(0.5)Numeric A3(0.9)Numeric A4(0.95)Numeric A5(0.99)Numeric A6(1.01)Numeric A7(1.05)Numeric A8(1.1)Numeric A9(1.5)ff(A2)f(A3)f(A4)f(A5)f(A6)f(A7)f(A8)f(A9)Numeric C2(0.500000000000001)Numeric C3(0.900000000000001)Numeric C4(0.950000000000001)Numeric C5(0.990000000000001)Numeric C6(1.01)Numeric C7(1.05)Numeric C8(1.1)Numeric C9(1.5)g(x) = (x - 1) / (x^(2) - 1)h(x) = sin(x) / xgg(C2)g(C3)g(C4)g(C5)g(C6)g(C7)g(C8)g(C9)Numeric E2(0.5)Numeric E3(0.1)Numeric E4(0.05)Numeric E5(0.01)Numeric E6(-0.01)Numeric E7(-0.05)Numeric E8(-0.1)Numeric E9(-0.5)hh(E2)h(E3)h(E4)h(E5)h(E6)h(E7)h(E8)h(E9)(A2, B2)(A3, B3)(A4, B4)(A5, B5)(A6, B6)(A7, B7)