
Inverse Function Graphing
Loading the math board and drawing, please wait…
In collections
Algebraic and transcendental functions
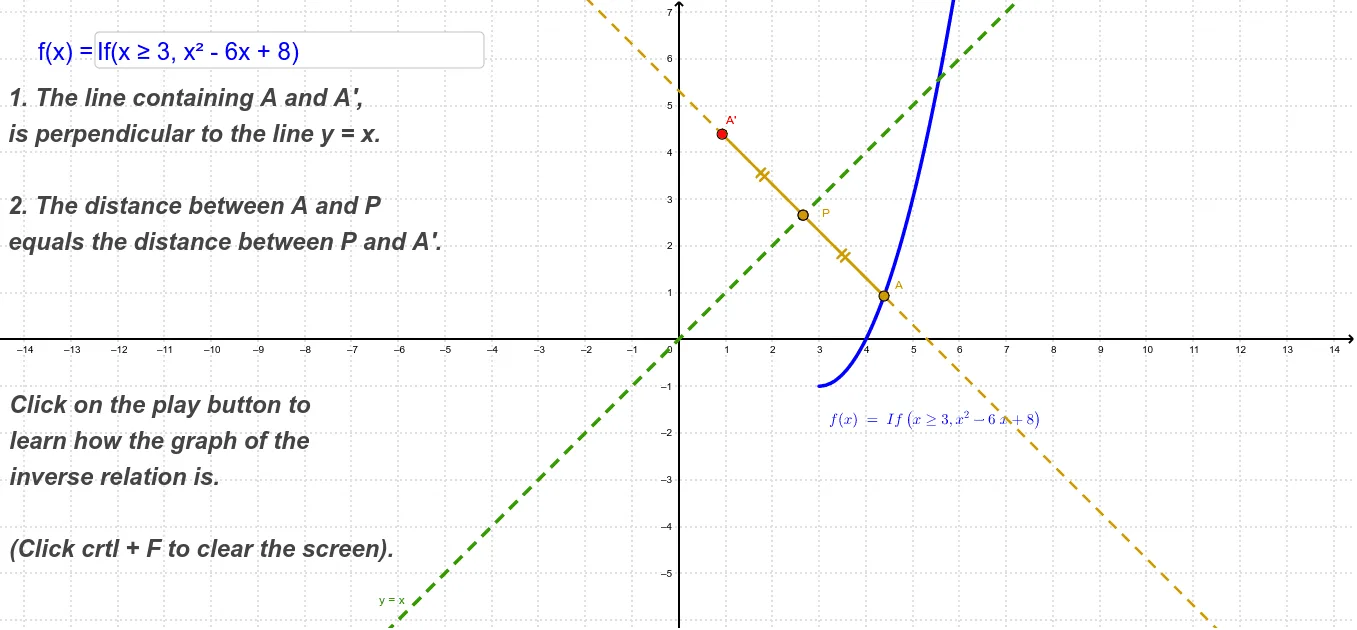
This example demonstrates how to graph an inverse function, involving core concepts like inverse function definition, symmetry, and coordinate geometry. It uses GeoGebra commands and objects such as Textfield, Point, OrthogonalLine, Intersect, Segment, Mirror for construction. Suitable for high school mathematics teaching and function graphing learning.
GeoGebra Commands & Parameters
Textfield(f) → CasillaDeEntrada1Point(f) → AOrthogonalLine(A, id) → gIntersect(g, id) → PSegment(A, P) → hMirror(A, id) → A'Mirror(P, id) → B'Segment(A', B') → h'
AI Drawing Prompt Reference
Draw a function curve and mark a point on it. From this point, draw a perpendicular line to the x-axis and connect the point to the intersection point to form a segment. Reflect this segment across the perpendicular line to get a mirrored segment. Also, reflect the origin across the perpendicular line to get a mirrored point, and connect this point to the intersection point of the perpendicular line with the x-axis to form another segment. Finally, display all key points and segments, and label the function curve and the two symmetric segments.
The prompt above was compiled from the original drawing commands and is for reference only.