
Introduction to Polar Coordinates by Dan Mosher
Loading the math board and drawing, please wait…
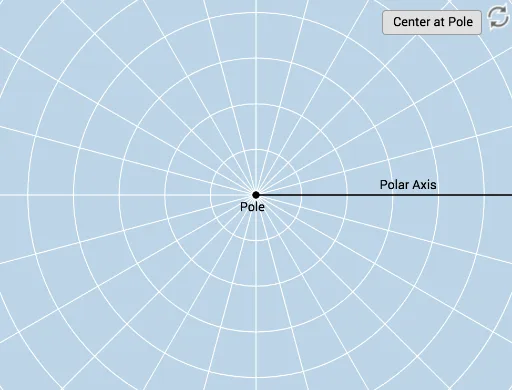
This example demonstrates plotting points using polar coordinates through an interactive introduction. Users can visually grasp the meaning and plotting method of polar coordinates (r, θ). Key math concepts include the definition of polar coordinates, the application of polar radius and angle. Construction highlights involve GeoGebra commands/objects like Ray, Circle, Textfield, Rotate, CircleArc, Angle, Intersect, Dilate, Vector, Line, and Mirror. Suitable for beginners in analytical geometry or learners reviewing polar coordinate concepts.
GeoGebra Commands & Parameters
Ray(B, C) → fCircle(B, D) → cTextfield(r) → InputBox1Textfield(b) → InputBox2Rotate(D, b, B) → D'Rotate(D, If[0 < d ≤ 1, (d * b), b], B) → D'_1CircleArc(B, D'_1, D) → eCircle(B, D) → gRay(B, D') → hCircleArc(B, D, D'_1) → kAngle(D, B, D') → αAngle(D', B, D) → βCircle(B, abs(r)) → pIntersect(p, h) → A,Dilate(B, If[1 < d ≤ 2, 2 - d, 0], A) → B'Vector(B, B') → uLine(B, A) → iMirror(B, B) → B'_1Mirror(D', B) → D''Ray(B'_1, D'') → h'Mirror(u, B) → u'Intersect(p, i) → E, F
AI Drawing Prompt Reference
Draw a polar coordinate system with point B as the center, and a circle and a ray. Users can input the polar radius r and angle b, then use rotation and mirroring to generate new points and arcs, demonstrating the position of a point in the polar coordinate system. Finally, use scaling and translation to show the point's position on the circle and its corresponding ray.
The prompt above was compiled from the original drawing commands and is for reference only.