
Introduction to Limits by Regina Greiwe Jackson
Loading the math board and drawing, please wait…
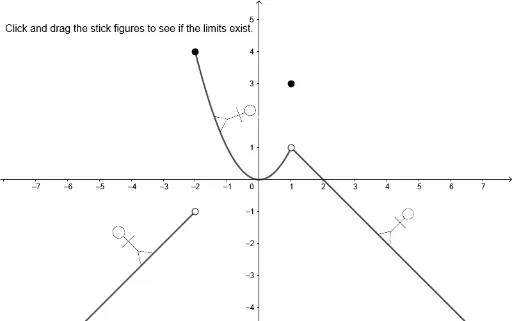
This example demonstrates the concept of limits, showing how the function value changes as a point approaches a certain value. Core math concepts include limits, function graphs, and dynamic points. Construction highlights: Point and Intersect commands are used. Suitable for beginners in calculus or educational demonstrations.
GeoGebra Commands & Parameters
Point(f) → APoint(g) → BIntersect(g, h, (1, 1)) → CPoint(f) → FPoint(f) → EPoint(g) → GPoint(g) → HPoint(h) → IPoint(h) → J
AI Drawing Prompt Reference
Draw a function graph to demonstrate how the function value changes as a point approaches a certain value. First, draw the graphs of functions f and g. Then, find the intersection point C of functions g and h at point (1, 1). Next, select points F and E on function f, and points G and H on function g. Finally, select points I and J on function h.
The prompt above was compiled from the original drawing commands and is for reference only.