
Introducing Derivatives - The Slope Function
Loading the math board and drawing, please wait…
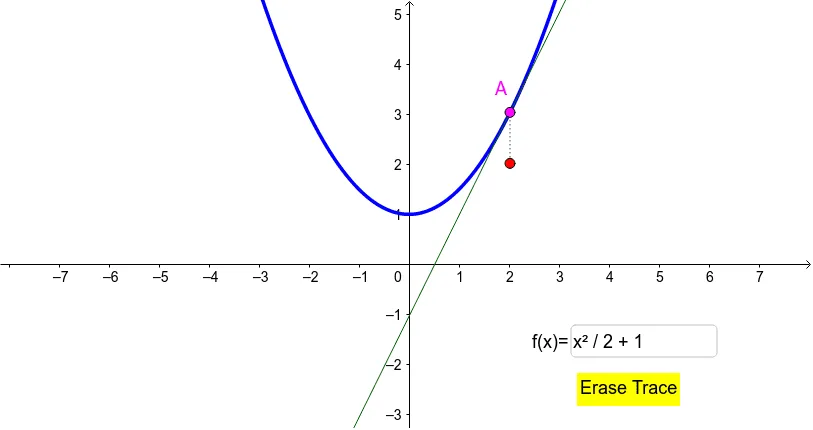
This example demonstrates how to use GeoGebra to draw the tangent line and its slope of a function f, visually showing the geometric meaning of derivatives. Core math concepts include derivatives, tangent function, and slope. Construction highlights the use of GeoGebra commands/objects like Point, Tangent, Slope, Segment, and Textfield. Suitable for high school and above students learning basic calculus concepts.
GeoGebra Commands & Parameters
Point(f) → ATangent(A, f) → aSlope(a) → mSegment(A, S) → bTextfield(f) → inputBox1
AI Drawing Prompt Reference
Draw a function's graph and show its tangent line and slope. First, mark a point on the function's curve, then draw a tangent line through this point and calculate its slope. Next, draw a line segment from the tangent point to the x-axis, and display the function's mathematical expression. The final graph should include the function curve, tangent line, slope segment, and function expression, visually demonstrating the geometric meaning of derivatives.
The prompt above was compiled from the original drawing commands and is for reference only.