
Intersections and Stochastic Process Demo
Loading the math board and drawing, please wait…
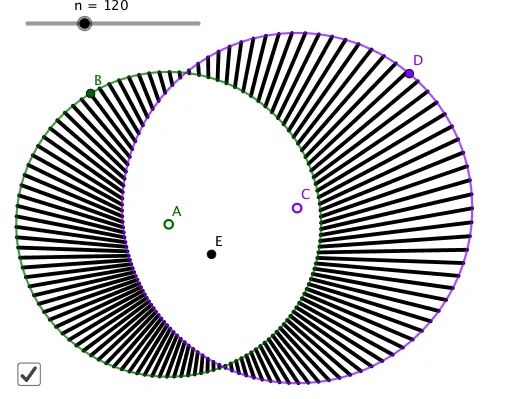
This example demonstrates the intersection relationships between circles and cylinders in 3D space, and simulates the geometric mean calculation of the hypergeometric distribution through stochastic processes. Key math concepts include intersections, stochastic processes, hypergeometric distribution, geometric mean, cylinders, and random experiments. It uses GeoGebra commands like Circle and Sequence, and objects A, B, c, C, D, d, n, E, L_1, a. Suitable for high school and above learners to understand the integration of spatial geometry and probability statistics.
GeoGebra Commands & Parameters
Circle(A, B) → cCircle(C, D) → dSequence(Segment[Intersect[c, Ray[Rotate[E, ((i * 360) * ° / n), E], Rotate[A, ((i * 360) * ° / n), E]]], Intersect[d, Ray[Rotate[E, ((i * 360) * ° / n), E], Rotate[A, ((i * 360) * ° / n), E]]]], i, 1, n) → L_1
AI Drawing Prompt Reference
Visualize the intersection relationships between two circles and a cylinder in 3D space, and simulate the geometric mean calculation of the hypergeometric distribution through stochastic processes. Start by drawing two circles, then generate multiple intersection points by rotating and extending rays, and finally connect these points to form segments, showing the distribution of intersections and the geometric representation of stochastic processes.
The prompt above was compiled from the original drawing commands and is for reference only.