
Intersection Points of Linear Equations
Loading the math board and drawing, please wait…
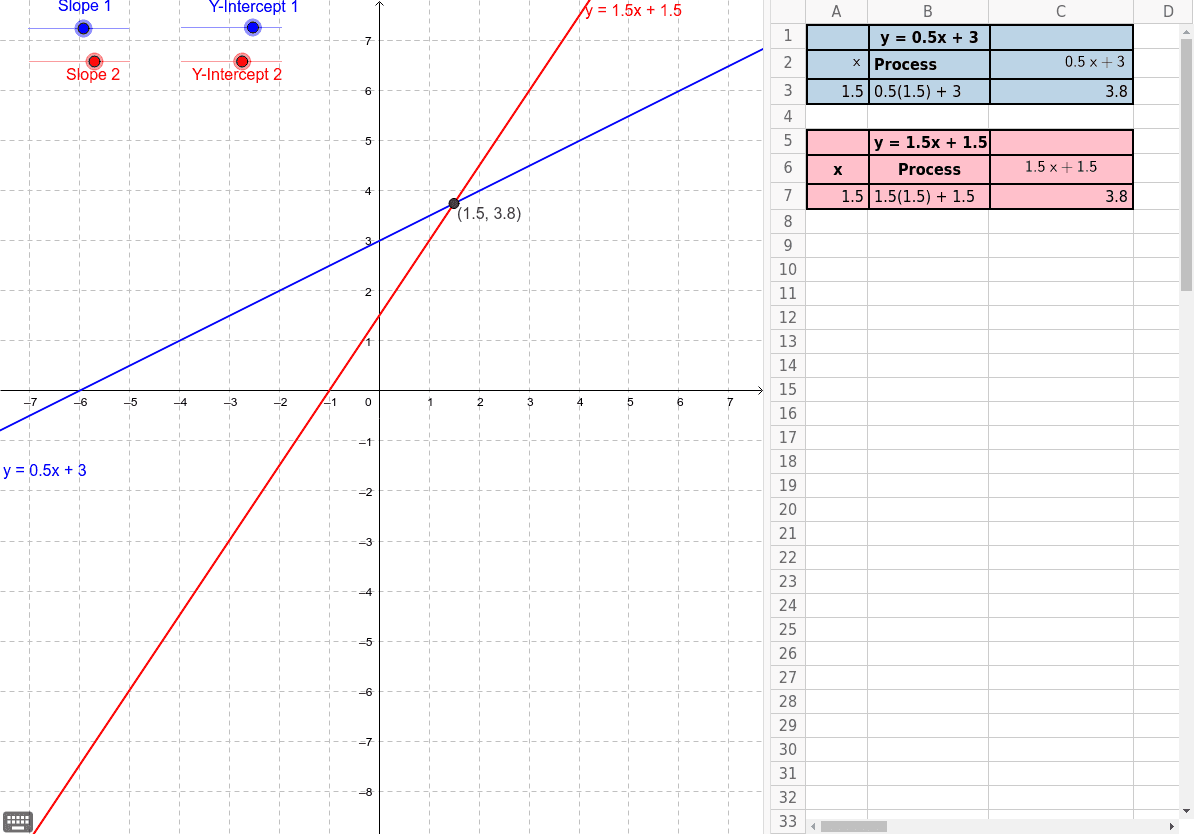
This example demonstrates the relationship between the intersection point of the graphs of two linear equations and the solution to the system of equations. Key math concepts include linear equations, function graphs, and systems of equations. It uses the Intersect command and involves objects like a, b, c, d, c_1, e, A, Z2, A3, C3, A2, B3, B2, Y2, B6, A6, C2, C6, A7, B7, C7, B1, B5. Suitable for middle school and above students learning to solve systems of linear equations and understand properties of function graphs.
GeoGebra Commands & Parameters
Intersect(e, c_1) → A
AI Drawing Prompt Reference
Draw the graphs of two linear equations and mark their intersection point to illustrate how the graphical representation shows the solution to the system of linear equations. First, plot the first line, then the second line, and finally identify and label the intersection point of the two lines, which represents the common solution of the linear equations.
The prompt above was compiled from the original drawing commands and is for reference only.