
Intersection Points of Implicit Curves Scanning Method
Loading the math board and drawing, please wait…
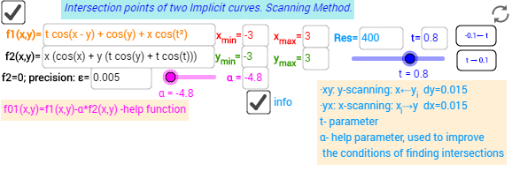
This example demonstrates how to find intersection points of two implicit curves using a scanning method. Key math concepts include implicit curves, intersection calculations, and scanning method principles. GeoGebra commands and objects used in the construction are Textfield, RemoveUndefined, Zip, TableText, ImplicitCurve, Polygon, etc. Suitable for high school and above students to understand implicit curve intersection solving methods and programming concepts.
GeoGebra Commands & Parameters
Textfield(Nn) → InputBox4Textfield(e) → InputBox5Textfield(x_{min}) → InputBox6Textfield(x_{max}) → InputBox7Textfield(y_{min}) → InputBox8Textfield(y_{max}) → InputBox9RemoveUndefined(Join[Sequence[Zip[a + (0, y_{min} + (dy2 * (s0 - 1))), a, {Roots[f01(x, y_{min} + (dy2 * (s0 - 1))), x_{min}, x_{max}]}], s0, 1, Nn + 1]]) → RootsxyRemoveUndefined(Join[Sequence[Zip[a + (0, x_{min} + (dx2 * (s0 - 1))), a, {Roots[f01(x_{min} + (dx2 * (s0 - 1)), x), y_{min}, y_{max}]}], s0, 1, Nn + 1]]) → RootsyxRemoveUndefined(KeepIf[abs(f2(x(A), y(A))) ≤ e, A, Rootsxy]) → listxy_0RemoveUndefined(KeepIf[abs(f2(y(A), x(A))) ≤ e, A, Rootsyx]) → listyx_0Zip((x(a), y(a)), a, listxy_0) → listxya_0Zip((y(a), x(a)), a, listyx_0) → listyxa_0TableText({Join[{{"Roots_{yx}"}, listyxa_0}]}, "vr") → text34TableText({Join[{{"Roots_{xy}"}, listxya_0}]}, "vr") → text23Textfield(α) → InputBox2ImplicitCurve(f1(x, y)) → aImplicitCurve(f2(x, y)) → bImplicitCurve(f01(x, y)) → cPolygon((x_{min}, y_{min}), (x_{max}, y_{min}), (x_{max}, y_{max}), (x_{min}, y_{max})) → poly1, f, g, h, iTextfield(f1) → InputBox1Textfield(f2) → InputBox3RemoveUndefined(Zip[(x(a), y(a)), a, Join[{listxya_0, listyxa_0}]]) → listxyres0Textfield(t) → InputBox10
AI Drawing Prompt Reference
Draw the intersection points of two implicit curves using a scanning method. Set parameter ranges and an error threshold, then find intersection points within the specified range and connect those that meet the criteria. Finally, plot the two implicit curves and the bounding rectangle of the parameters, labeling all intersection points with their coordinates.
The prompt above was compiled from the original drawing commands and is for reference only.