
Intermediate Value Theorem
Loading the math board and drawing, please wait…
In collections
Fun with Functions
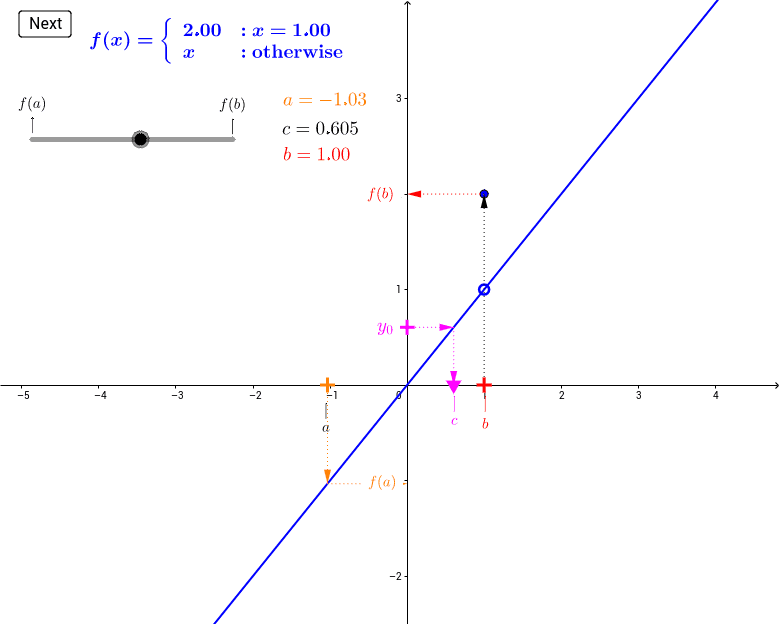
This applet illustrates the Intermediate Value Theorem. By adjusting the slider, it shows that there exists a c such that f(c) equals y0. Commands used include Point, Element, If, Textfield, OrthogonalLine, Vector, etc. Suitable for high school math education.
GeoGebra Commands & Parameters
Point(xAxis) → BPoint(xAxis) → APoint(xAxis) → SplitPointElement(flist, nf) → gIf(nf ≠ 2, If[aa < bb, Root[g(x) - fc, aa, bb], If[bb < aa, Root[g(x) - fc, bb, aa], (aa, 0)]], (c2, 0)) → CCIf(nf ≠ 2, If[aa ≟ bb, aa, x(CC)], If[c2in ≤ 0, c2]) → xcTextfield(f_{left}) → inputBox1Textfield(f_{right}) → inputBox2OrthogonalLine(F, xAxis) → aVector(A, AFA) → uVector(B, BFB) → vVector(BFB, B0) → wVector(AFA, A0) → bVector(C, CFC) → cVector(CFC, CC) → d
AI Drawing Prompt Reference
Draw a function graph and show that there exists a point c such that the function value equals y0 by adjusting the slider. First, create three points on the x-axis, A, B, and SplitPoint. Then, based on the input function expression, draw the function graph g. Next, find the root CC of the function g at y0 and determine the position of the root xc. Finally, input the function expression through the text field to draw the function graph and use vertical lines and vectors to display key points and segments.
The prompt above was compiled from the original drawing commands and is for reference only.