
Intermediate Value Theorem Demo
Loading the math board and drawing, please wait…
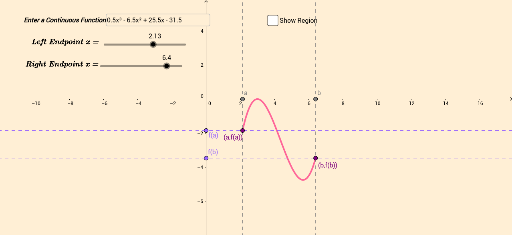
This example demonstrates the Intermediate Value Theorem graphically, showing that a continuous function must take on any intermediate value within a given interval. Key math concepts include continuous functions and the IVT. Construction uses commands like Textfield, CurveCartesian, Line, IntegralBetween with objects such as f, a, b, c. Suitable for high school students and calculus beginners.
GeoGebra Commands & Parameters
Textfield(f) → InputBox1CurveCartesian(t, f(t), t, a, b) → cLine(A, D) → gLine(B, E) → hIntegralBetween(((-(x(g) / y(g))) * x) - z(g) / y(g), ((-(x(h) / y(h))) * x) - z(h) / y(h), a, b) → eLine(A, C) → jLine(B, F) → kIntegralBetween(((-(x(g) / y(g))) * x) - z(g) / y(g), ((-(x(h) / y(h))) * x) - z(h) / y(h), -1000000000, 100000000) → d