
Interactive Visualization of Increasing and Decreasing Functions
Loading the math board and drawing, please wait…
In collections
Thomas S - Working with Polynomial Functions in IM3
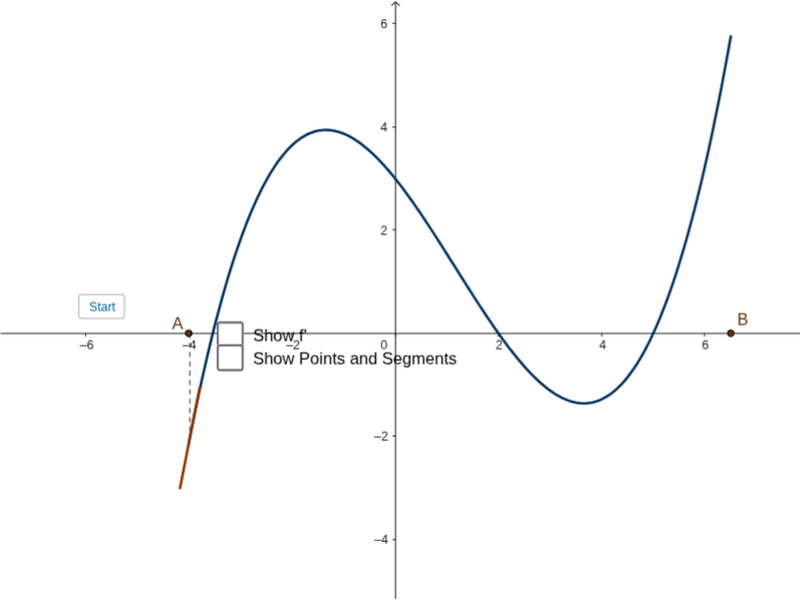
This GeoGebra applet provides an interactive visual demonstration of the increasing and decreasing intervals of a continuous function, helping students connect the algebraic sign of the derivative with the geometric behavior of the function graph. The core mathematical concepts include function monotonicity, first derivative test, tangent lines, and critical points. In terms of construction, the applet utilizes the Function command to plot the function f(x) and its derivative f'(x), while the If command is employed to dynamically color-code or highlight intervals based on the sign of the derivative. The Tangent command is used to draw local tangent lines at movable points, and UnitVector along with Segment are used to construct directional indicators showing the trend of increase or decrease. Intersection points are calculated using the Intersect command to mark local extrema. Interactive elements like buttons and custom variables manage the state of the demonstration. This tool is highly suitable for high school calculus introductory courses, college-level calculus classrooms, or self-paced online learning environments to illustrate the applications of derivatives.
GeoGebra Commands & Parameters
Intersect(f', xAxis) → M, NFunction(f, -4, 6.5) → gIf((a > 0) ∧ (a < 1), X_1, If[(b ≥ 0) ∧ (b < 1) ∧ a ≟ 1, X_2, If[(c ≥ 0) ∧ (c < 1) ∧ b ≟ 1, X_3]]) → XTangent(C, g) → eUnitVector(e) → uSegment(X, C) → dSegment(C - u, C + u) → hSegment(M, (x(M), g(x(M)))) → kSegment(N, (x(N), g(x(N)))) → l
AI Drawing Prompt Reference
Draw a coordinate plane with a continuous function curve and its derivative curve. Place a movable point on the function curve, show its tangent line, and use arrow segments to indicate increasing or decreasing trend at that point. Color the function curve in segments based on the sign of the derivative: warm colors where derivative is positive, cool colors where negative. Mark the intersections of the derivative curve with the x-axis, draw vertical dashed lines through them to meet the function curve, and label the local extrema. Overall, illustrate the correspondence between monotonic intervals and derivative signs.
The prompt above was compiled from the original drawing commands and is for reference only.