
Interactive Venn Diagram for Set Theory with Movable Elements
Loading the math board and drawing, please wait…
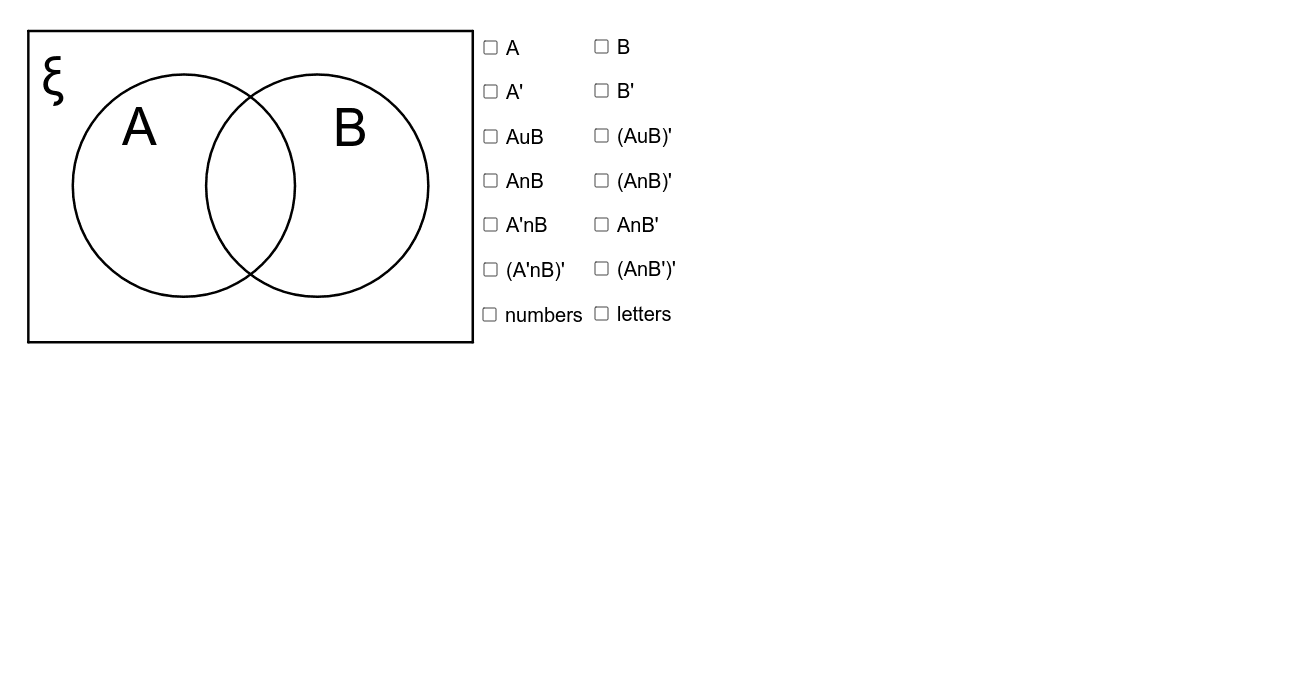
This example presents an interactive Venn diagram that uses movable letters and numbers to illustrate the contents and cardinalities of each set. It demonstrates key set‑theoretic concepts such as union, intersection, complement and cardinality, and connects to probability and statistics through visual representation of overlapping events. The construction employs GeoGebra commands Point (for vertices), Circle (for circles), Polygon (to form regions), Intersect (to compute overlaps) and CircleArc (for arcs), creating a dynamic learning tool. It is intended for high‑school and early‑university students studying discrete mathematics, set theory and introductory probability.
GeoGebra Commands & Parameters
Point(yAxis) → ACircle(A, 5) → AboldPoint(xAxis) → BCircle(B, 5) → BboldPolygon(C, D, E, F) → Ubold, c_1, d_1, e, fIntersect(Abold, Bbold, 1) → GIntersect(Abold, Bbold, 2) → HCircleArc(A, G, H) → AarcCircleArc(B, G, H) → AsarcCircleArc(A, H, G) → BsarcCircleArc(B, H, G) → BarcCircle(A, 5) → AshadeCircle(B, 5) → BshadePolygon(C, D, E, F) → Ushade, K_2, K_3, K_4, K_5Circle(A, 5) → AwhiteCircle(B, 5) → BwhiteCircleArc(B, G, H) → AsarcwhiteCircleArc(A, H, G) → BsarcwhiteCircleArc(A, H, G) → BsarcxCircleArc(B, G, H) → Asarcx