
Interactive Trigonometric Equation Solving and Graphing
Loading the math board and drawing, please wait…
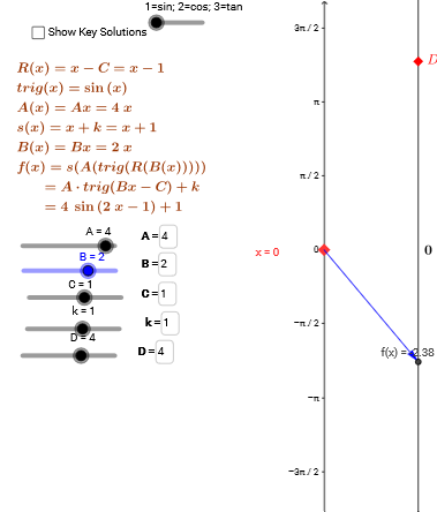
This GeoGebra example demonstrates the graphical solution of trigonometric equations such as sin(x)=k through an interactive interface. Core mathematical concepts include trigonometric functions, equation solving, intersections of function graphs, and the influence of parameters on solutions. Construction highlights: using commands like Element, Textfield, Point, Vector, and Intersect, it builds sliders (k), input boxes (inputBox1/2/3), function graphs (trig), and intersection points (C, R) to dynamically show how the number and positions of solutions change as parameters vary. Suitable for high school or pre-university students learning trigonometric equations, function graphing, and numerical methods, as well as for classroom demonstrations or self-exploration of parameter effects.
GeoGebra Commands & Parameters
Element(trl, fnum) → trigElement(atrl, fnum) → atrigElement(atrl2, fnum) → atrig2Textfield(B) → inputBox1Textfield(s) → inputBoxfPoint(yAxis) → A_xVector(K, s_{inv}D) → wVector(s_{inv}D, m_{invSinvD}) → zVector(m_{invSinvD}, q_{inv+}) → dVector(q_{inv+}, I) → h_1Textfield(C) → inputBox2Textfield(k) → inputBox3Textfield(A) → inputBox4Textfield(B) → inputBox5Textfield(s) → inputBox6Vector(m_{invSinvD}, P_2) → uVector(P_2, J) → jVector(I, E) → vVector(J, D) → cTextfield(B) → inputBox7Vector(A_x, F) → mVector(F, G) → nVector(G, H) → pVector(H, L) → qVector(L, M) → rTextfield(D_n) → inputBox8Vector(A_x, M) → tVector(K, E) → u_1Vector(K, D) → v_1Intersect(trf, a_1, (10.348809000348663, 4.000000000468522)) → N