
Interactive Time Line Tool
Loading the math board and drawing, please wait…
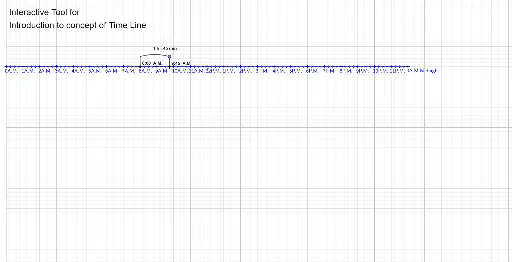
This is an interactive time line tool for exploring the concept of a time line. It dynamically displays points and segments on a time line to help understand the basic concepts. The tool uses CircleArc, Segment, Point, Sequence, and Line commands in GeoGebra, suitable for middle school and above students or teachers.
GeoGebra Commands & Parameters
CircleArc(C, D, D_4) → cSegment(D_4, D_1) → fSegment(D_2, D) → gPoint(c) → ASequence(Text[If[i ≟ 12 ∧ Mod[i, 12] ≟ 0, 12, If[i ≟ 24, 0, Mod[i, 12]]] + " " + (If[i < 12, " A.M.", If[i ≟ 24, " A.M. Midnight", " P.M."]]), (i - 0.15, -0.1), true, true], i, 0, 24, 1) → listtimelabelsSequence((i, 0), i, 0, 24, 1) → listxaxismainticksSequence((i, 0), i, 0, 24, 0.25) → listxaxisminorticksSegment((0, 0), (24, 0)) → hLine(B, E) → iPoint(i) → F
AI Drawing Prompt Reference
Create an interactive timeline showing hours from 0 to 24, with each hour marked and labeled as AM/PM, featuring major and minor tick marks below the timeline. Include a circle arc connected to one end of the line and a point at the other, to explore time concepts dynamically.
The prompt above was compiled from the original drawing commands and is for reference only.