
Interactive Shading of Venn Diagrams
Loading the math board and drawing, please wait…
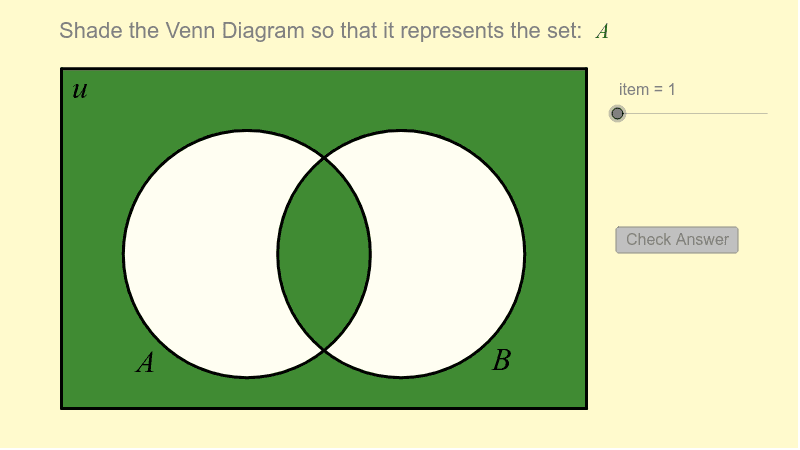
This GeoGebra applet provides a visual demonstration of shading different regions within Venn diagrams to represent set operations. It focuses on core mathematical concepts of set theory, including intersections, unions, and complements. The construction employs the 'Polygon' command to create shaded areas and the 'If' command to implement conditional coloring based on boolean objects (e.g., IsGreen variables), ensuring dynamic updates of the regions. It utilizes 'Segment' and 'Corner' for precise geometric boundary definition. This resource is ideal for secondary school students and educators teaching set theory or basic probability.
GeoGebra Commands & Parameters
Segment((x_1, y_1), (x_1, y_2)) → eSegment((x_1, y_2), (x_2, y_2)) → fSegment((x_2, y_1), (x_2, y_2)) → gSegment((x_2, y_1), (x_1, y_1)) → hIf(IsGreen1, 0, 1) → RB1If(IsGreen1, 0.4, 1) → G1If(IsGreen2, 0, 1) → RB2If(IsGreen3, 0, 1) → RB3If(IsGreen4, 0, 1) → RB4If(IsGreen2, 0.4, 1) → G2If(IsGreen3, 0.4, 1) → G3If(IsGreen4, 0.4, 1) → G4Element(problem, item, 1) → textitemLength(problem) → iElement(problem, item, 2) → keyPolygon(Corner[1], Corner[2], Corner[3], Corner[4]) → poly1, l, m, n, qCorner(5) → G
AI Drawing Prompt Reference
Draw a Venn diagram with three overlapping circles. Each circle represents a set, and the overlapping areas show intersections. The union area shows all sets, and the outside parts represent complements. The diagram should clearly illustrate set operations for teaching purposes.
The prompt above was compiled from the original drawing commands and is for reference only.