
Tree Diagrams and Venn Diagrams
Loading the math board and drawing, please wait…
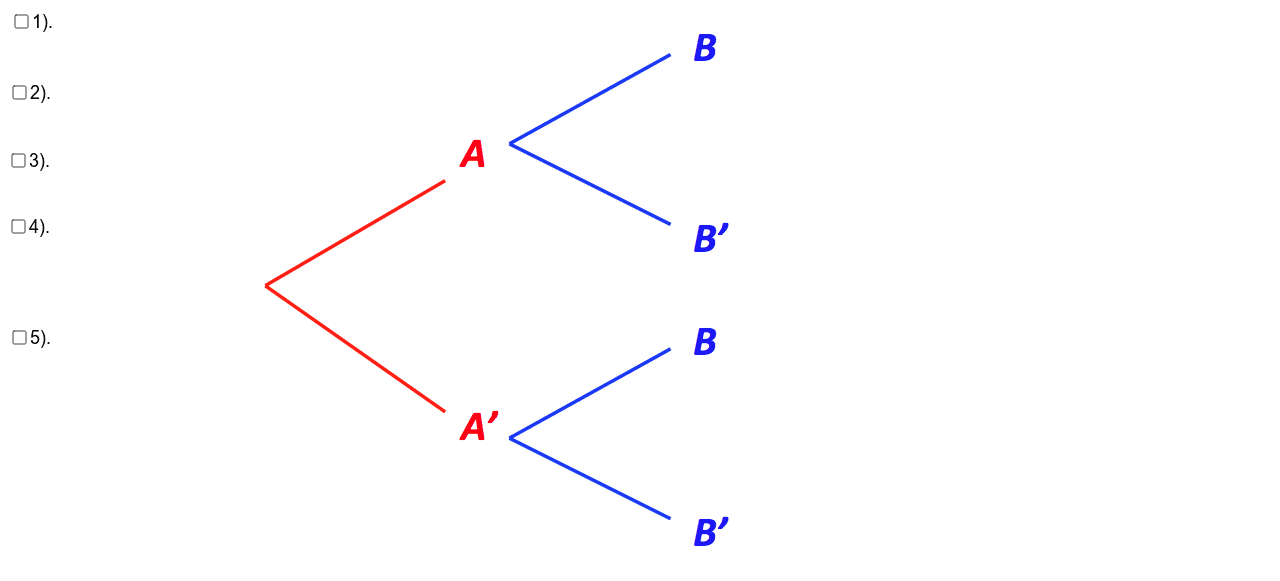
This example demonstrates probability tree diagrams and Venn diagrams. These diagrams help visualize the occurrence of probability events. Key mathematical concepts include probability calculation and set theory. GeoGebra commands used include pic2 to pic16, such as various shapes and text labels. Suitable for students at the junior high school level and above for learning probability and statistics.
GeoGebra Commands & Parameters
Boolean a(false)Boolean b(false)Boolean c(false)Boolean d(false)Boolean e(false)
AI Drawing Prompt Reference
Create a probability tree diagram and a Venn diagram to illustrate the relationship between two events A and B. Start by drawing two branches from the root for event A, one for A occurring and one for A not occurring, and label them with their respective probabilities. Then draw two branches from each of these for event B, and label them similarly. Finally, draw a Venn diagram to show the intersection, union, and complements of events A and B, using different colors for each region, and add text labels to explain each part.
The prompt above was compiled from the original drawing commands and is for reference only.