
Interactive Note: Tangent Line Equation
Loading the math board and drawing, please wait…
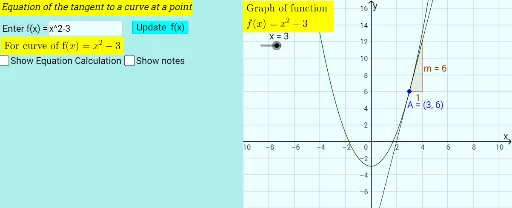
This example demonstrates dynamically drawing the tangent line to a curve at a point and displaying its equation. Key math concepts include derivatives, tangent line equations, slope, and function graphing. It is constructed using GeoGebra commands like Point, Tangent, Slope, Coefficients, and Textfield for interactive plotting, suitable for high school mathematics teaching or self-learning to understand the geometric meaning of derivatives and tangents.
GeoGebra Commands & Parameters
Textfield(textfx) → InputBox1Point(f) → ATangent(A, f) → gSlope(g) → mCoefficients(f) → L_1Min(f, -10, 10) → BMax(f, -10, 10) → CMax(y(B) - 5, -15) → yminMin((2 * xmax) - 3, y(C) - 5) → ymaxCorner(1) → C_1Corner(4) → C_4Polygon(C_1, C_2, C_3, C_4) → coverbox, d, e, f_1, g_1
AI Drawing Prompt Reference
Create a dynamic illustration showing the tangent line to a curve at a selected point and its equation. Start by adding an input box for the function, then plot a point on the curve and draw the tangent line at that point, displaying its equation. Calculate the slope of the tangent line and the coefficients of the original function. Adjust the coordinate axes range appropriately and include a bounding box to highlight the tangent line and equation.
The prompt above was compiled from the original drawing commands and is for reference only.