
Interactive Linear Programming and Function Graphing Exploration
Loading the math board and drawing, please wait…
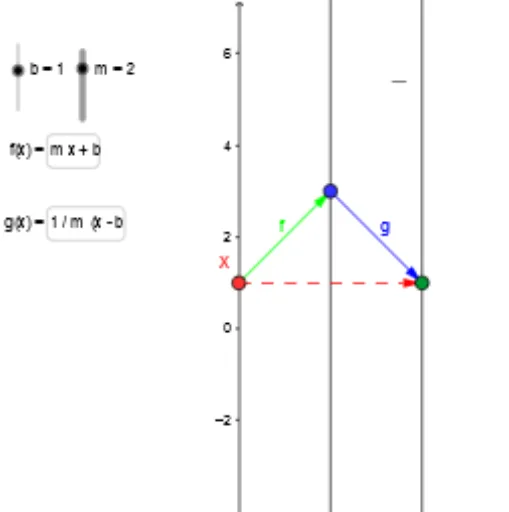
This GeoGebra example demonstrates how to build an interactive model for solving linear programming problems. By setting up objective functions, constraint conditions (represented by functions f and g), and decision variables (controlled by points and vectors), the solution process for optimal values becomes visually intuitive. The core mathematical concepts include linear functions, feasible regions, objective function optimization, and constrained extreme value problems. Construction points: Use the Point command to create decision points, Vector commands to construct vectors representing constraint boundaries, Textfield and inputBox for parameter input and text display, and function commands to define objective functions and constraints. Suitable for high school mathematics curriculum on linear programming, useful for demonstrating the geometric meaning of optimal solutions, helping students understand extreme value problems under constraints, and can also serve as training material for math competitions.
GeoGebra Commands & Parameters
Point(yAxis) → XVector(X, B) → fVector(B, C) → gTextfield(f_2) → inputBox1Textfield(g_2) → inputBox2Vector(B, D) → vVector(X, C) → u
AI Drawing Prompt Reference
Create an interactive coordinate plane for linear programming instruction. Place a movable point on the y-axis as the decision origin. From this point, draw a vector to another point representing the first constraint, and another vector to a third point for the second constraint. Additionally, draw a vector from the decision origin to a fourth point, and a vector from the y-axis point to the third point, forming the feasible region boundaries. Add two text input boxes beside the graph for entering objective function and constraint parameters, allowing dynamic adjustment. The overall display shows the feasible region, constraint vectors, and the geometric relationship of objective optimization.
The prompt above was compiled from the original drawing commands and is for reference only.