
Interactive Introduction to Slope
Loading the math board and drawing, please wait…
In collections
Graphing Linear Functions
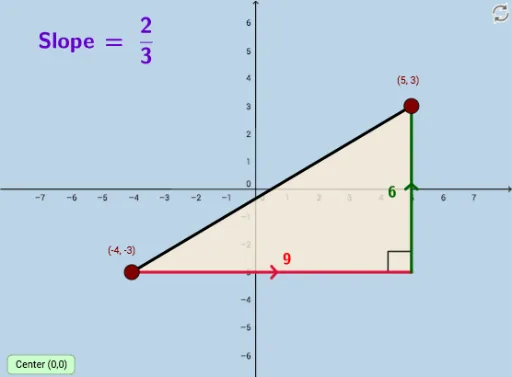
This example demonstrates the calculation of line slope using coordinates of two points. Core math concepts include coordinate geometry, distance between two points, GCD, etc. Key GeoGebra commands used are GCD, If, OrthogonalLine, Intersect, Line, Polygon, Distance, Segment, Angle, Slope. Suitable for middle school students and above learning coordinate geometry and slope concepts, or for teaching demonstrations.
GeoGebra Commands & Parameters
GCD(deltaY, deltaX) → GCDmGCD(numerYint, deltaX) → GCDyIf(sgn(deltaY / deltaX) ≥ 0, "", "-") → textSignNIf(sgn(numerYint / deltaX) > 0, "+", "-") → textSignIf(deltaXR ≟ 1, textSignN + deltaYR, textSignN + "\, \frac{" + deltaYR + "}{" + deltaXR + "}") → textslopeNIf(denomYintR ≟ 1, textSign + numerYintR, textSign + "\frac{" + numerYintR + "}{" + denomYintR + "}") → textYintIf(denomYintR ≟ 1, If[numerYintR ≟ 1, textSign, textSign + numerYintR], textSign + "\frac{" + numerYintR + "}{" + denomYintR + "}") → textMIDOrthogonalLine(B, xAxis) → a_2OrthogonalLine(A, yAxis) → cIntersect(a_2, c) → CLine(A, B) → dPolygon(A, B, C) → poly1, c_1, a_1, b_1Distance(B, C) → distanceBCDistance(A, C) → distanceACIntersect(a_2, c) → DSegment(A, D) → eSegment(C, B) → fGCD(deltaY_1, deltaX_1) → GCDm_1If(sgn(deltaY_1 / deltaX_1) ≥ 0, "", "-") → textSignN_1If(deltaXR_1 ≟ 1, textSignN_1 + deltaYR_1, textSignN_1 + "\, \frac{" + deltaYR_1 + "}{" + deltaXR_1 + "}") → textslopeN_1Line(A_1, B_1) → d_1Angle(B, D, A) → αSegment(A, B) → gGCD(deltaY_2, deltaX_2) → GCDm_2If(sgn(deltaY_2 / deltaX_2) ≥ 0, "", "-") → textSignN_2If(deltaXR_2 ≟ 1, textSignN_2 + deltaYR_2, textSignN_2 + "\, \frac{" + deltaYR_2 + "}{" + deltaXR_2 + "}") → textslopeN_2Line(A_2, B_2) → d_2Segment(A_2, B_2) → g_1GCD(deltaY_3, deltaX_3) → GCDm_3If(sgn(deltaY_3 / deltaX_3) ≥ 0, "", "-") → textSignN_3If(deltaXR_3 ≟ 1, textSignN_3 + deltaYR_3, textSignN_3 + "\, \frac{" + deltaYR_3 + "}{" + deltaXR_3 + "}") → textslopeN_3Line(A_3, B_3) → d_3Segment(A_3, B_3) → g_2Slope(g) → h
AI Drawing Prompt Reference
Draw two intersecting lines and mark their intersection point. From the intersection point, draw perpendicular lines to each of the original lines, marking the feet of the perpendiculars. Select two points on each line, calculate the distance between them and the slope of the line, and label the slope values as fractions and decimals. Also, calculate the lengths of the perpendicular segments and label all computed results in the graph to demonstrate the application of slope, distance, and GCD in coordinate geometry.
The prompt above was compiled from the original drawing commands and is for reference only.