
Interactive Impedance Figure: AC Circuit Vectors
Loading the math board and drawing, please wait…
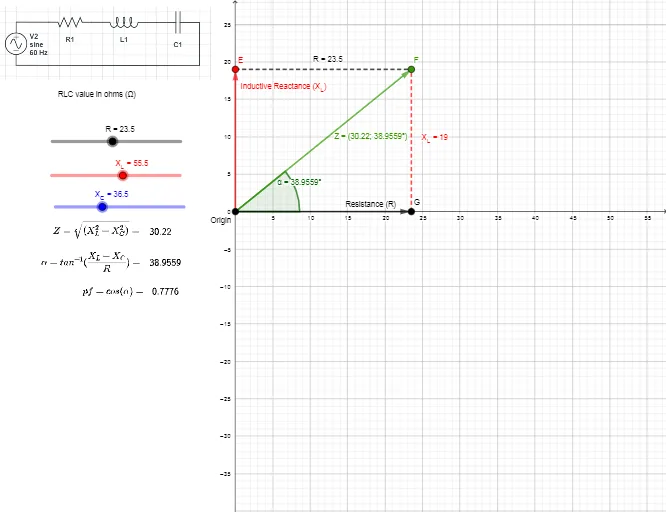
① This interactive GeoGebra example visualizes the impedance of an AC circuit as a vector diagram, showing how resistance (R), inductive reactance (X_L), and capacitive reactance (X_C) combine. ② It demonstrates core mathematical concepts: two-dimensional vectors, trigonometric functions for phase angles, complex number representation, and vector subtraction to find the resultant impedance. ③ The construction uses GeoGebra commands such as Point, Segment, Angle, Vector, and LaTeX for formulas, with dynamic sliders for R, X_L, and X_C; objects include points A, B, D, E, G, F, and multiple text labels for values. ④ This resource is suitable for high school or university physics/engineering courses, helping students grasp impedance calculations and phase relationships in AC circuits through hands-on exploration.
GeoGebra Commands & Parameters
Point(yAxis) → DPoint(c) → EPoint(b) → GPoint(a) → FSegment(E, F) → fSegment(G, F) → gAngle(G, D, F) → αVector(D, E) → uPoint(f) → CSegment(G, F) → hLaTeX(d) → text5LaTeX($2) → text6LaTeX($3) → text7
AI Drawing Prompt Reference
Create a vector diagram visualizing the impedance of an AC circuit, showing how resistance, inductive reactance, and capacitive reactance combine. Use dynamic sliders for resistance, inductive reactance, and capacitive reactance, and label their values. Draw vectors starting from the origin for resistance, then add vectors for inductive and capacitive reactance to show their combination and the resultant impedance. Include angle measurements for phase differences and label key points and vectors.
The prompt above was compiled from the original drawing commands and is for reference only.