
Interactive Demonstration of Inequalities and Geometric Constructions
Loading the math board and drawing, please wait…
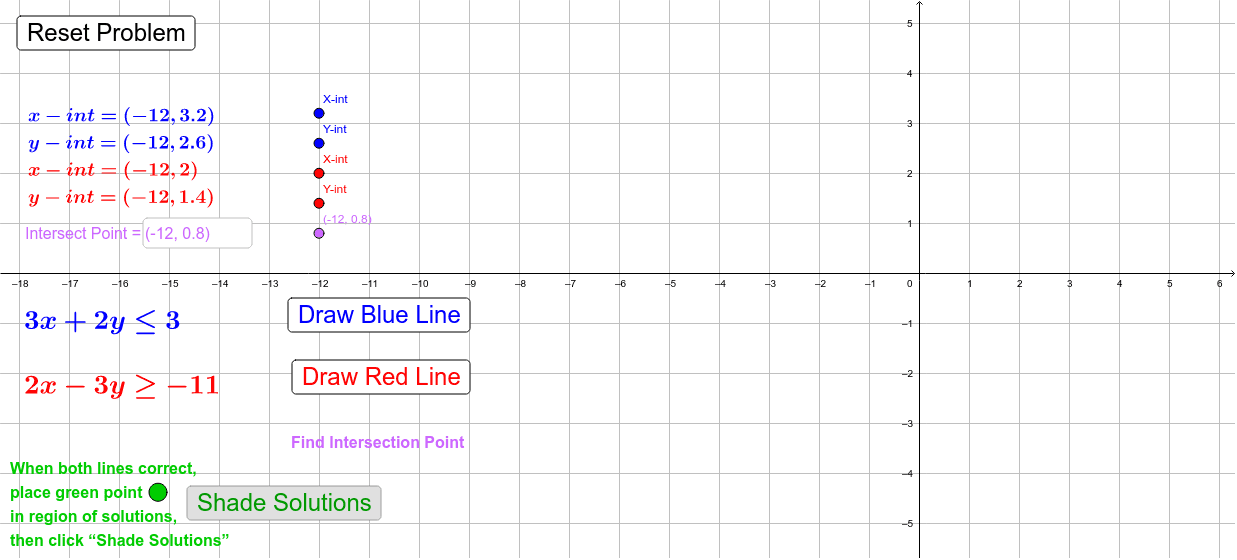
This example demonstrates the interaction between inequalities and geometric figures. Key mathematical concepts include inequalities, parametric equations, and geometric constructions. Construction involves using GeoGebra commands such as Intersect, Line, IsInRegion, etc. Suitable for high school students or college freshmen for learning the application of inequalities in geometry.
GeoGebra Commands & Parameters
Intersect(rline, bline) → IntPtLine(SRXI, SRYI) → SrlineLine(SBXI, SBYI) → SblineIntersect(bline, x = 0) → CBYIIntersect(bline, y = 0) → CBXIIntersect(rline, y = 0) → CRXIIntersect(rline, x = 0) → CRYIIsInRegion(SOP, overlap) → SoverlapcorrectTextfield(SIP) → InputBox1
AI Drawing Prompt Reference
Draw a figure with two lines, rline and bline, which intersect at point IntPt. Then draw two vertical lines from the x-axis and y-axis, intersecting bline at points CBXI and CBYI, and rline at points CRXI and CRYI. Use these points to define a region overlap, and check if point SIP is within this region. Finally, add an input box InputBox1 for entering the coordinates of point SIP.
The prompt above was compiled from the original drawing commands and is for reference only.