
Ordering Rational and Irrational Numbers with Geometry & Parametric Curves
Loading the math board and drawing, please wait…
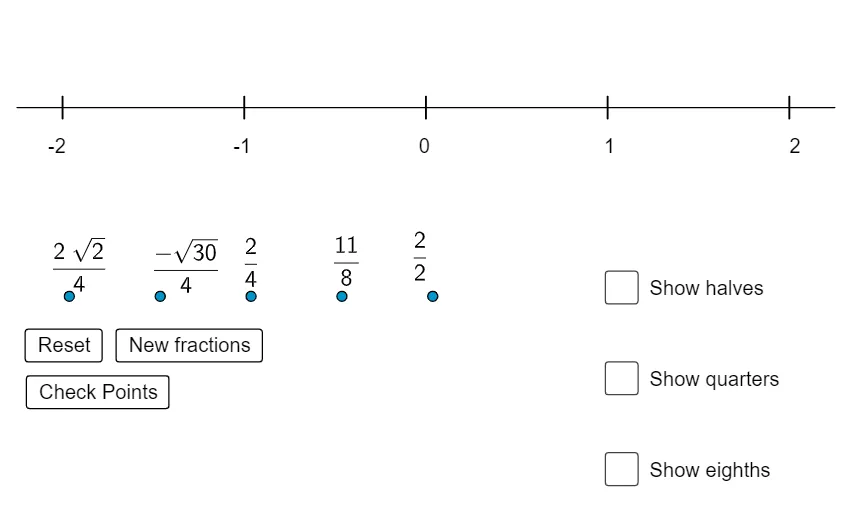
This example demonstrates how to compare and visually order rational and irrational numbers within a single geometric/number-representation setup. It highlights the relationship between the numeric ordering on the line and the appearance of corresponding points generated by parametric constructions. Key concepts include rational vs. irrational numbers, inequality-based size comparisons, and the use of parametric curves/point sequences to model candidate values. The construction emphasizes GeoGebra commands and objects such as Sequence (to generate an ordered list of points or parameter values) and Segment (to build supporting geometric references). Additional plotted entities—like circles, hyperbola-related structures, and secant/line elements—provide visual anchors for interpreting the ordering. Text annotations and numerical-control parameters (e.g., error thresholds and size constraints such as too small/too big and density settings) help the visualization remain stable under finite precision. Suitable for middle school through early university, especially for lessons connecting number theory ideas with geometric construction, analytic visualization, and exploratory learning.
GeoGebra Commands & Parameters
Sequence(RandomElement[dens], i, 1, 5) → list6_1Sequence(Random[(-2 * Element[list6_1, i]), (2 * Element[list6_1, i])], i, 1, 5) → list7_1Sequence(Element[list7, i] / Element[list6, i], i, 1, 5) → flistSequence((-x(Element[list8, i])) + Element[flist, i] > error, i, 1, 5) → toosmallSequence(x(Element[list8, i]) - Element[flist, i] > error, i, 1, 5) → toobigSegment(A, B) → f_1Sequence(Segment[(-2 + i, -0.12), (-2 + i, 0.12)], i, 0, 4, 1) → list1Sequence(Text[-2 + i, (x(C) + (1.02 * i), y(C))], i, 0, 4) → list2Sequence(Segment[(-2 + i, -0.11), (-2 + i, 0.11)], i, 0, 4, 0.5) → list3Sequence(Segment[(-2 + i, -0.09), (-2 + i, 0.09)], i, 0, 4, 0.25) → list4Sequence(Segment[(-2 + i, -0.07), (-2 + i, 0.07)], i, 0, 4, 0.125) → list5Sequence((RandomElement[{-1, 1}] * sqrt(Random[1, (2 * Element[list6_1, i]^(2))])), i, 1, 5) → list9Sequence(RandomElement[{Element[list7_1, i], Element[list9, i]}], i, 1, n) → list7_2
AI Drawing Prompt Reference
Visualize the ordering of rational and irrational numbers on a line using geometry and parametric curves. Generate a sequence of random points, compare their sizes based on inequalities, and represent these relationships with line segments of varying thicknesses, including annotations for values. Include auxiliary circles, hyperbola-related structures, and secant/line elements for visual reference. Use parameters and text annotations to explain the ordering, suitable for connecting number theory with geometric construction and analytic visualization.
The prompt above was compiled from the original drawing commands and is for reference only.