
Interactive Demo: Regression and Correlation
Loading the math board and drawing, please wait…
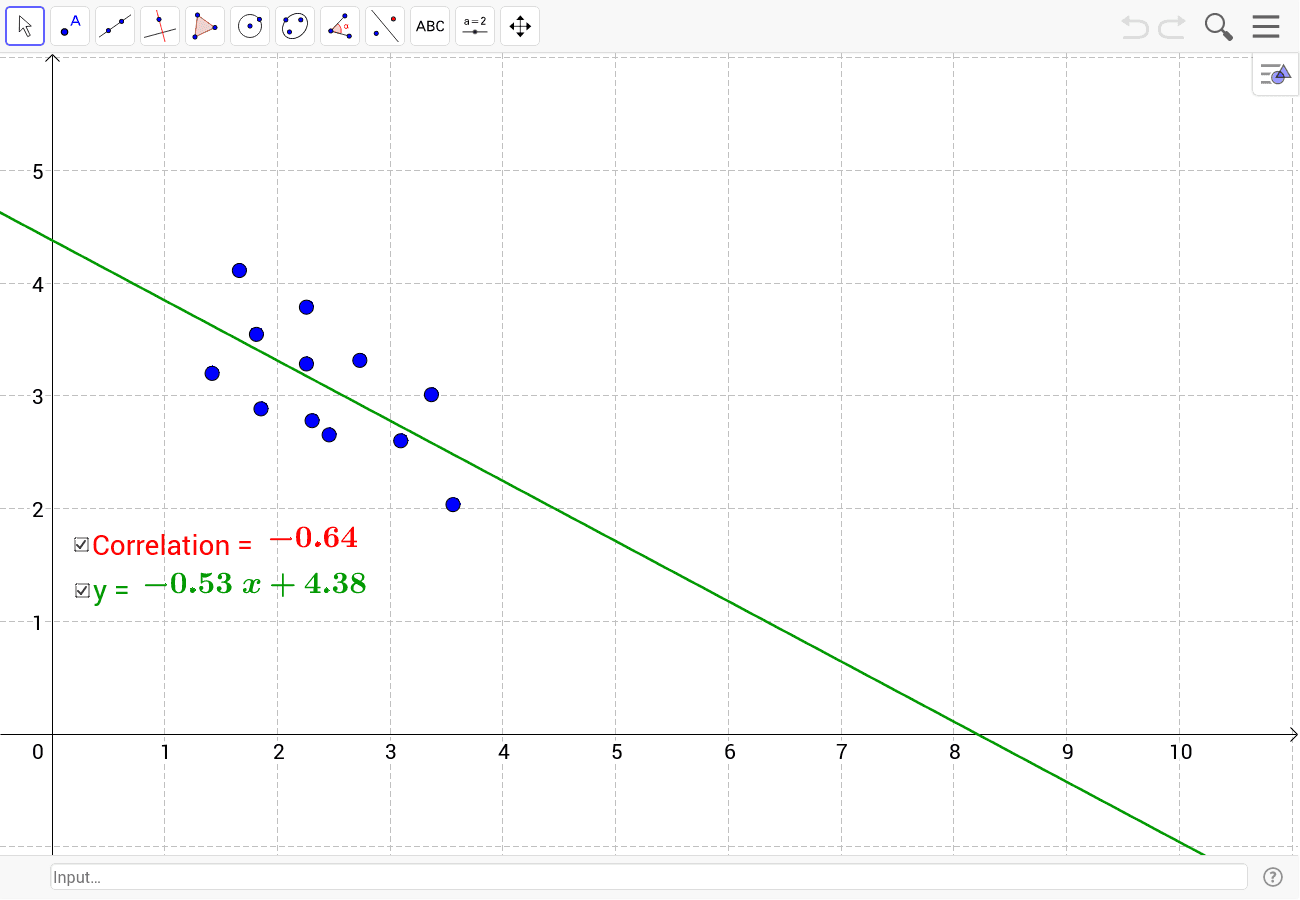
This example demonstrates the correlation between data points and the least squares regression line by allowing users to move points around. Key math concepts include Pearson's correlation coefficient (PMCC), linear regression, and statistical data analysis. GeoGebra commands like PMCC for correlation calculation and FitPoly for regression line fitting, along with objects such as L, K, J, I, H, G, F, E, D, C, B, A, X, cor, f, a, b, text2, text1, are utilized for visualization. Suitable for high school and above learners to understand core statistical concepts.
GeoGebra Commands & Parameters
PMCC(X) → corFitPoly(X, 1) → f
AI Drawing Prompt Reference
Create a scatter plot showing the relationship between data points and a linear regression line, with the Pearson correlation coefficient calculated and displayed. Allow the data points to be moved, so the regression line adjusts dynamically. Include a best-fit line and a text label showing the correlation coefficient.
The prompt above was compiled from the original drawing commands and is for reference only.