
Interactive Demo of Linear Equations and Statistical Graphs
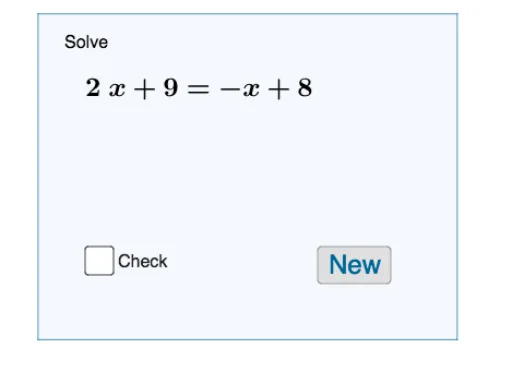
Loading the math board and drawing, please wait…
This example demonstrates the interaction between linear equations and statistical graphs, including integers, histograms, statistical characteristics, trapezoids, and cones. Key math concepts involve solving linear equations, generating random integers, plotting statistical graphs, and constructing geometric figures. GeoGebra commands like Random, RandomElement, Factor, Solve, and Polygon, along with objects such as list1, a, b, m, n, f, g, p, q, solution, text1, text2, text3, c, button1, A, B, C, D, q1, a_1, b_1, c_1, d, are used in the construction. Suitable for high school mathematics education to understand the application of linear equations and the integration of statistics with geometry.
GeoGebra Commands & Parameters
Random(-10, 10) → aRandom(-10, 10) → bRandomElement(list1) → mRandomElement(list1) → nFactor(Simplify[f]) → pFactor(Simplify[g]) → qSolve(f = g) → solutionPolygon(A, B, C, D) → q1, a_1, b_1, c_1, d
AI Drawing Prompt Reference
Demonstrate the interaction between linear equations and statistical graphs, including random integers, histograms, statistical characteristics, trapezoids, and cones, controlled by sliders, generating random integers, plotting statistical graphs, solving linear equations, and constructing geometric figures, with key mathematical concepts highlighted.
The prompt above was compiled from the original drawing commands and is for reference only.