
Integral and Derivatives Lesson
Loading the math board and drawing, please wait…
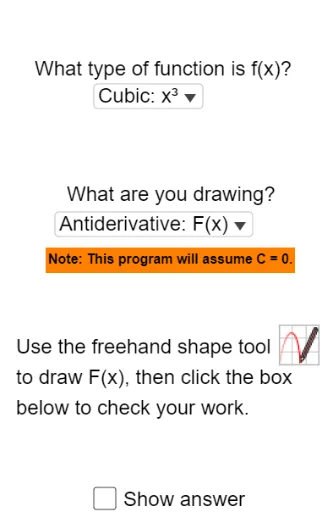
① This GeoGebra example dynamically illustrates the relationship between integrals and derivatives, showing how accumulated area and tangent slopes connect. ② Core math concepts include the derivative (instantaneous rate of change), the definite integral (accumulated area), and the Fundamental Theorem of Calculus, with auxiliary visualizations using polygons, scatter plots, and spheres. ③ Construction highlights: uses If and Element commands on lists (list1, list2, list3), defines functions f and g, creates points A through H, adds text labels (text1-text6), inserts an image (pic1), and uses a slider (a) to animate changes, making the integral area and derivative tangent lines interactive. ④ Suitable for high school to early college calculus instruction, ideal for classroom demonstrations, self-study, or review, bridging abstract concepts with geometric intuition.
GeoGebra Commands & Parameters
If(SelectedIndex[list1] ≟ 1, Polynomial[{A, B, C}], If[SelectedIndex[list1] ≟ 2, Polynomial[{A, B, C, D}], If[SelectedIndex[list1] ≟ 3, Polynomial[{A, B, C, D, E}], Polynomial[{A, B, C, D, E, F}]]]) → fElement({"F(x)", "f'(x)", "f''(x)"}, SelectedIndex[list2]) → list3If(SelectedIndex[list2] ≟ 1, Integral[f], Derivative[f, SelectedIndex[list2] - 1]) → g
AI Drawing Prompt Reference
Draw a function f and its first and second derivatives g to illustrate the relationship between integration and differentiation. First, plot the function f, then draw the corresponding derivative g based on the selected derivative order. Use a slider to dynamically adjust the function shape and display the function, derivative curves, and their geometric meanings.
The prompt above was compiled from the original drawing commands and is for reference only.