
Mean, Median, Mode Geometric Construction Example
Loading the math board and drawing, please wait…
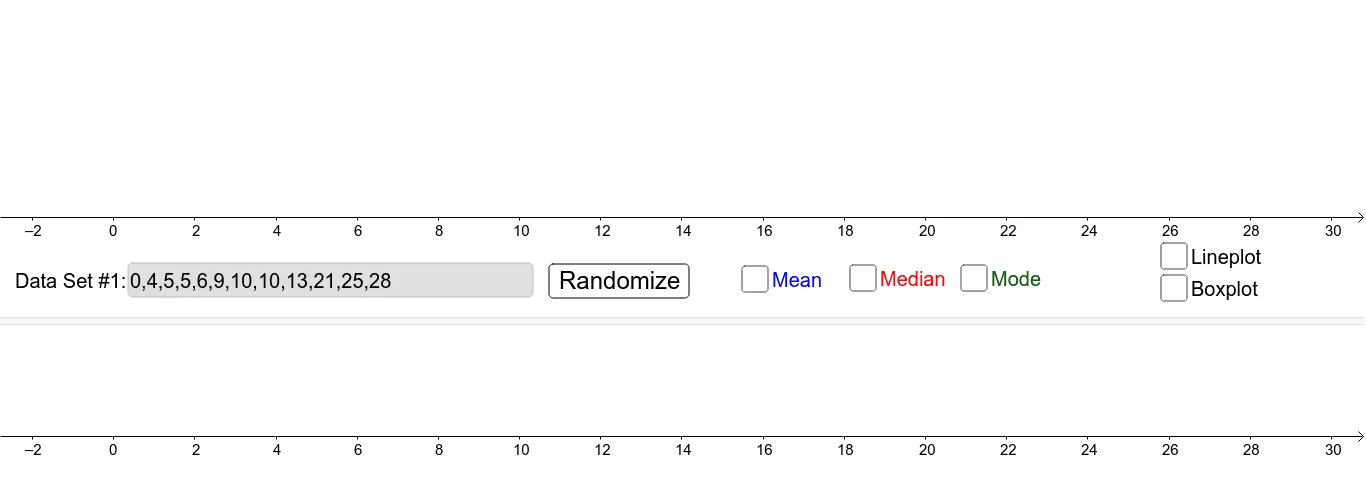
This example demonstrates the calculation of mean, median, and mode using GeoGebra. Key mathematical concepts include statistical measures of central tendency and the relationship between geometric shapes and data distribution. Construction involves commands like Textfield, Remove, Flatten, Sequence, If, DotPlot, Zip, Line, Sort, UnicodeToText, BoxPlot, and objects such as ds1, ds2, plot1, plot2. Suitable for middle school students learning statistics or high school students practicing data analysis.
GeoGebra Commands & Parameters
Textfield(ds1Text) → InputBox1Remove(TextToUnicode[ds1Text], Sequence[32, i, 1, Length[TextToUnicode[ds1Text]]]) → unicode1Flatten(Join[{{{0}, Remove[Sequence[If[Element[unicode1, i] ≟ 44, i, 0], i, 1, Length[unicode1]], Sequence[0, i, 1, Length[unicode1]]]}, {Length[unicode1] + 1}}]) → locationOfCommas1Sequence(Take[unicode1, Element[locationOfCommas1, i] + 1, Element[locationOfCommas1, i + 1] - 1], i, 1, Length[locationOfCommas1] - 1) → removedCommas1Sequence(UnicodeToText[Element[removedCommas1, i]], i, 1, Length[removedCommas1]) → backToNumbers1If(Length[ds1Text] > 0, RemoveUndefined[Sort[Zip[FromBase[A, 10], A, backToNumbers1]]], {}) → ds1Textfield(ds2Text) → InputBox2Remove(TextToUnicode[ds2Text], Sequence[32, i, 1, Length[TextToUnicode[ds2Text]]]) → unicode2Flatten(Join[{{{0}, Remove[Sequence[If[Element[unicode2, i] ≟ 44, i, 0], i, 1, Length[unicode2]], Sequence[0, i, 1, Length[unicode2]]]}, {Length[unicode2] + 1}}]) → locationOfCommas2Sequence(Take[unicode2, Element[locationOfCommas2, i] + 1, Element[locationOfCommas2, i + 1] - 1], i, 1, Length[locationOfCommas2] - 1) → removedCommas2Sequence(UnicodeToText[Element[removedCommas2, i]], i, 1, Length[removedCommas2]) → backToNumbers2If(Length[ds2Text] > 0, RemoveUndefined[Sort[Zip[FromBase[A, 10], A, backToNumbers2]]], {}) → ds2DotPlot(ds1) → plot1DotPlot(ds2) → plot2If(Defined[Min[Join[{ds1, ds2}]]], Min[Join[{ds1, ds2}]], 0) → minIf(Defined[Max[Join[{ds1, ds2}]]], Max[Join[{ds1, ds2}]], 10) → maxIf(Defined[Max[{Max[Frequency[ds1]], Max[Frequency[ds2]], 3}]], Max[{Max[Frequency[ds1]], Max[Frequency[ds2]], 3}], 3) → heightZip(Line[(A, 0), x = 0], A, Mode[ds1]) → mode1Zip(Line[(A, 0), x = 0], A, Mode[ds2]) → mode2Line((mean[ds1], 0), x = 0) → mean1Line((mean[ds2], 0), x = 0) → mean2Line((Median[ds1], 0), x = 0) → med1Line((Median[ds2], 0), x = 0) → med2Sort(Sequence[Random[0, 30], i, 1, Random[8, 16]]) → random1Sort(Sequence[Random[0, 30], i, 1, Random[10, 20]]) → random2Flatten(Sequence[TextToUnicode[Text[Element[random1, i] + ","]], i, 1, Length[random1]]) → random1asTextUnicodeToText(First[random1asText, Length[random1asText] - 1]) → ds1RandomBoxPlot(height / 2, height / 5, ds1) → boxPlot1BoxPlot(height / 2, height / 5, ds2) → boxPlot2Flatten(Sequence[TextToUnicode[Text[Element[random2, i] + ","]], i, 1, Length[random2]]) → random2asTextUnicodeToText(First[random2asText, Length[random2asText] - 1]) → ds2Random