
Influence of Outliers on Mean and Median
Loading the math board and drawing, please wait…
In collections
Mean, Median, Mode
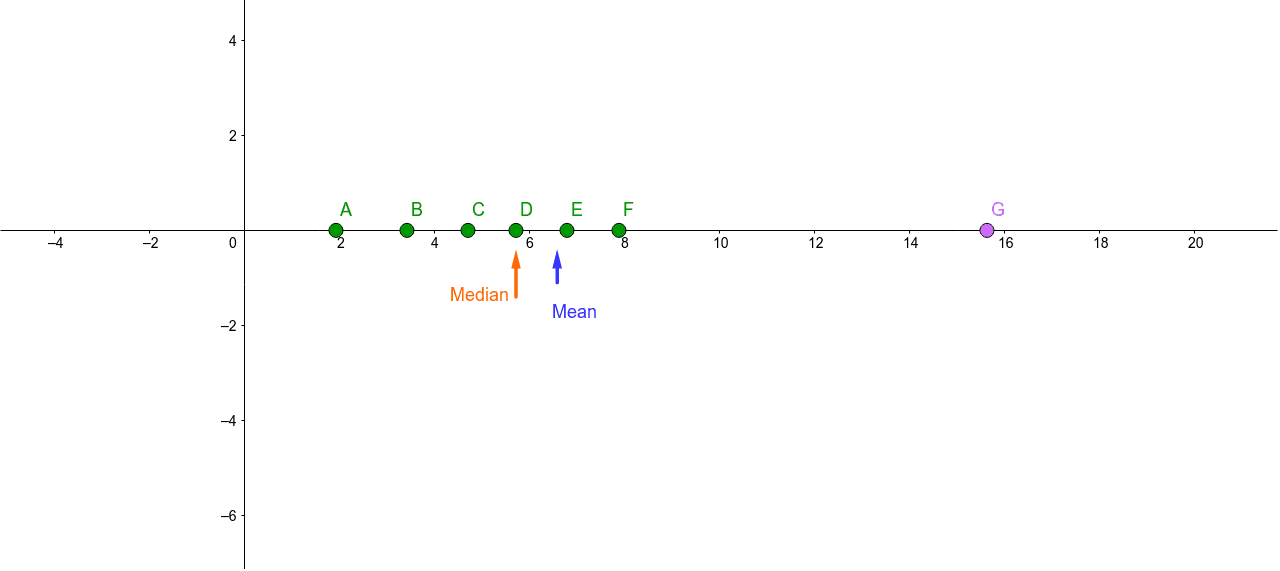
This example demonstrates how outliers affect the mean and median of a dataset. By adjusting the position of data points, the impact of outliers on statistical measures can be observed intuitively. Key mathematical concepts include mean and median. GeoGebra commands used include Point, Median, Mean, and Vector. Suitable for middle school and above students or teachers for teaching and learning.
GeoGebra Commands & Parameters
Point(xAxis) → APoint(xAxis) → BPoint(xAxis) → CPoint(xAxis) → DPoint(xAxis) → EPoint(xAxis) → FPoint(xAxis) → GMedian({x(A), x(B), x(C), x(D), x(E), x(F), x(G)}) → medMean({x(A), x(B), x(C), x(D), x(E), x(F), x(G)}) → μVector((med, (-1.4)), (med, (-0.4))) → v_mVector((μ, (-1.1)), (μ, (-0.4))) → v_a
AI Drawing Prompt Reference
Draw a graph with seven points on the x-axis. Calculate the median and mean of these points and represent the vectors from the median to the mean and from the mean to a reference point. Ensure the graph visually demonstrates the impact of data points on statistical measures.
The prompt above was compiled from the original drawing commands and is for reference only.