
Dotplot Demonstration
Loading the math board and drawing, please wait…
In collections
Mean, Median, Mode
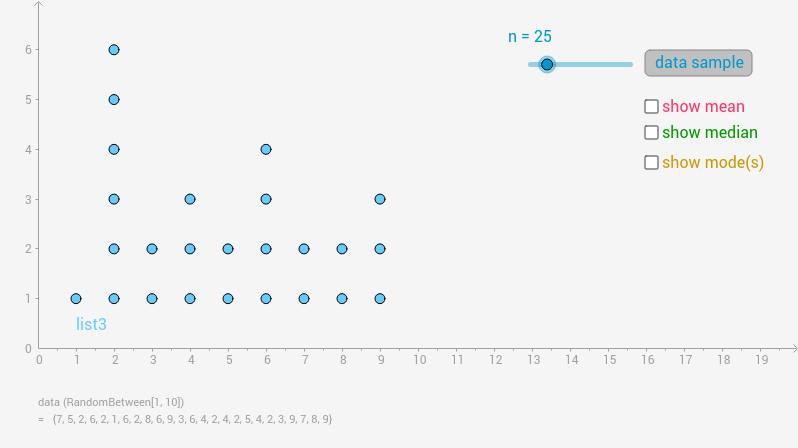
This example demonstrates the creation and analysis of a dotplot, involving key mathematical concepts such as mean, median, mode, frequency distribution, and geometric mean. It is constructed using GeoGebra commands like Sequence, DotPlot, Mean, Frequency, Median, Mode, suitable for high school mathematics education to understand data distribution and statistical calculations visualization.
GeoGebra Commands & Parameters
Sequence(Random[1, 10], i, 1, n) → list1DotPlot(list1) → list3Mean(list1) → meanFrequency(list1) → list2Median(list1) → medianMode(list1) → list4