
Inequality Graphing Check
Loading the math board and drawing, please wait…
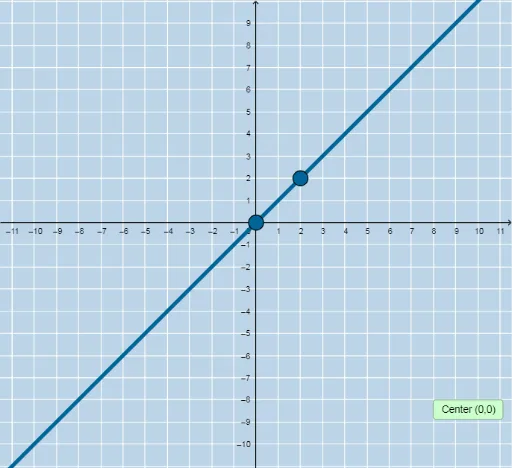
This example demonstrates how to use GeoGebra to graph inequalities. Key mathematical concepts include inequalities and fractions. Using commands like Sequence, Union, Random, and Line, the example dynamically shows the graph of inequalities. Suitable for high school math education and learning.
GeoGebra Commands & Parameters
Sequence(i, i, -10, -1) → aSequence(i, i, -10, -1) → bSequence(i, i, 1, 10) → cUnion(b, c) → dRandom(-10, 10) → eLine(A, B) → iFractionText(Slope[f]) → text1FractionText(f(0)) → text2Random(1, 4) → symbolLine(A, B) → hSlope(i) → slope_i
AI Drawing Prompt Reference
Draw a graph of inequalities using integer sequences from -10 to -1 and 1 to 10 as the boundaries of the x-axis, randomly select an integer as the boundary of the y-axis, draw two lines passing through points A and B, show the slope and y-intercept of the first line, and the slope of the second line.
The prompt above was compiled from the original drawing commands and is for reference only.