
Incremental Ratio Demonstration
Loading the math board and drawing, please wait…
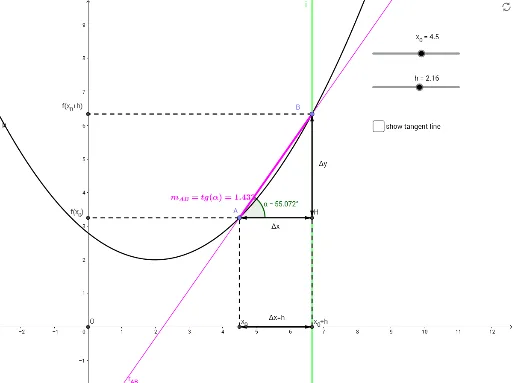
This example demonstrates the geometric representation of the incremental ratio between two points on a function graph. It involves core mathematical concepts such as derivatives, upper and lower sums (Riemann sums), difference and slope, unit circle, intersections, and confidence intervals. The construction utilizes GeoGebra commands like Intersect, OrthogonalLine, Segment, Vector, Angle, and If. It is suitable for high school and above students studying calculus and analytical geometry.
GeoGebra Commands & Parameters
Intersect(xAxis, yAxis) → OOrthogonalLine(A, yAxis) → gOrthogonalLine(B, yAxis) → h_1OrthogonalLine(B, xAxis) → iOrthogonalLine(A, xAxis) → jIntersect(j, xAxis) → CIntersect(i, xAxis) → C_1Intersect(h_1, yAxis) → EIntersect(g, yAxis) → FIntersect(i, g) → HSegment(C, C_1) → h_2Segment(A, H) → kSegment(H, B) → lSegment(A, F) → mSegment(B, E) → nVector(C_1, C) → uVector(C, C_1) → vVector(B, H) → wVector(H, B) → bVector(A, H) → cVector(H, A) → dSegment(C, A) → qSegment(C_1, H) → rAngle(H, A, B) → αIntersect(t, r) → IIntersect(t, i) → DAngle(H, A, D) → βSegment(A, B) → fIf(x(A) ≟ x(B), (p'(x(A)) * (x - x(A))) + y(A), ((y(B) - y(A)) / (x(B) - x(A)) * (x - x(A))) + y(A)) → r_{AB}Vector(H, H1) → hh1Vector(D, D1) → dd1Vector(H1, D1) → dyupVector(D1, H1) → dydw