
Improper Fractions Visual: Pie and Rectangle Comparison
Loading the math board and drawing, please wait…
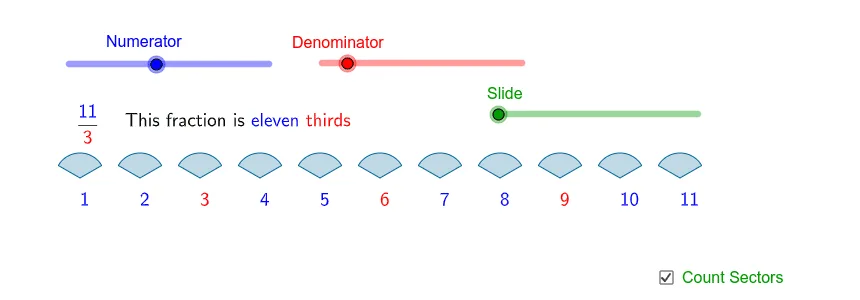
① This example uses both a pie chart and a rectangle diagram to visually represent improper fractions (where the numerator is greater than the denominator), showing their magnitude and composition. ② Core math concepts include the meaning of fractions, conversion between improper fractions and mixed numbers, continuous quantity partitioning, and addition, helping learners understand visual representations of fractions greater than one. ③ Construction highlights: GeoGebra commands such as If, Sequence, Div, Mod, and LaTeX are used to generate fraction parts, with multiple objects (k, A, b, a, r, p1, frs, nmbs, db, p2, p3, secs, c, a1, a2, b2, si, la, d, text2, e1a, e1b, e1c, e2a, e2c, text3, numbers, text1) creating dynamic graphics and text labels. ④ Suitable for upper elementary to middle school students learning fraction concepts, and useful for teacher demonstrations or student exploration of improper fractions and mixed numbers.
GeoGebra Commands & Parameters
If(a > 12, 14 / (a + 2), 1) → rSequence(A + (((1.2 * r) * (i - (k * Mod[i - 1, b]) - ((k * (b - 1)) * Div[i - 1, b]))), 0), i, 1, a) → p1Sequence(Rotate[Translate[Element[p1, i], Vector[(0, r / 2)]], 3.141592653589793 / b + (((2 * 3.141592653589793) * k) * Mod[i - 1, b] / b), Element[p1, i]], i, 1, a) → p2Sequence(Rotate[Translate[Element[p1, i], Vector[(0, r / 2)]], ((-3.141592653589793)) / b + (((2 * 3.141592653589793) * k) * Mod[i - 1, b] / b), Element[p1, i]], i, 1, a) → p3Sequence(CircleSector[Element[p1, i], Element[p3, i], Element[p2, i]], i, 1, a) → secsDiv(a, b) → cMod(a, b) → a1lt("=") → e1bIf(si, TableText[{{e1a, e1b, e1c}, {e2a, e1b, e2c}}, "rcl"], TableText[{{e1a, e2a}}]) → text3Sequence(Text[If[Mod[i, b] ≟ 0, rt["" + (i)], bt["" + (i)]], ((-0.09), (-0.2)) + Element[p1, i], true, true], i, 1, a) → numbersLaTeX(lm[frc["\blue{" + a + "}", "\red{" + b + "}"]]) → text1
AI Drawing Prompt Reference
Create a visual representation of improper fractions using a circular pie chart and a rectangular diagram. The pie chart consists of multiple sectors, each representing a unit fraction, with the number of sectors adjustable via sliders for numerator and denominator. The rectangle is divided into equal parts, with some parts shaded to show the fraction's magnitude. Include dynamic text labels displaying the fraction and its mixed number equivalent, along with numbers marking each sector or part. The layout should be clear and educational, suitable for classroom demonstration.
The prompt above was compiled from the original drawing commands and is for reference only.