
Illustrator for 1-Variable Inequalities
Loading the math board and drawing, please wait…
In collections
Solving Inequalities
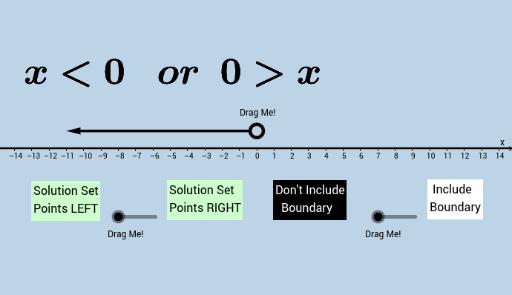
This example illustrates the graphical representation of 1-variable inequalities. Key mathematical concepts include inequalities and their representation on the number line. Dynamic drawing of inequality solutions is achieved using GeoGebra commands such as Random, Segment, and Point. Suitable for middle school and above students to learn about inequalities and their solutions.
GeoGebra Commands & Parameters
Random(-10, 10) → aSegment((-10, 1), (10, 1)) → hPoint(h) → ARandom(1, 4) → eRandom(0, 1) → rDynamicCoordinates(A, round(x(A)), 1) → BVector((x(B) + 0.4, 1), (11, 1)) → uVector((x(B) - 0.4, 1), (-11, 1)) → v