
Identifying Outliers by Steve Phelps
Loading the math board and drawing, please wait…
In collections
AP Stats Exam Review
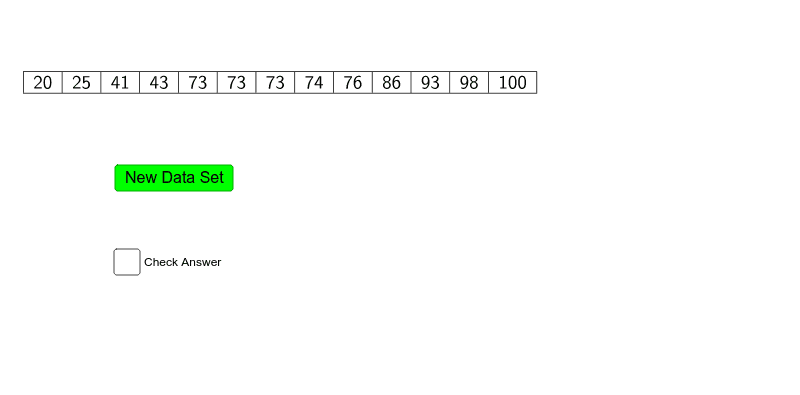
This example demonstrates how to identify outliers in a dataset using GeoGebra. Key math concepts include quartiles (Q1, Q3), interquartile range (IQR), and outlier definitions. Construction highlights involve using Random to generate data, Sort to order it, TableText to display it, and Q1, Q3 to calculate quartiles, with a button to compute lower and upper cutoff values. Suitable for high school statistics and probability education.
GeoGebra Commands & Parameters
Random(8, 20) → numdataSort(Sequence[Random[10, 100], a, 1, numdata]) → dataTableText({data}, "|_c") → text1Q1(data) → aQ3(data) → b
AI Drawing Prompt Reference
Display how to identify outliers using a randomly generated dataset, first by generating and sorting the data, then calculating the first and third quartiles, and finally marking the outliers based on the interquartile range, with the entire process shown in a table and a button to compute the lower and upper cutoff values.
The prompt above was compiled from the original drawing commands and is for reference only.