
Identifying Derivatives Activity
Loading the math board and drawing, please wait…
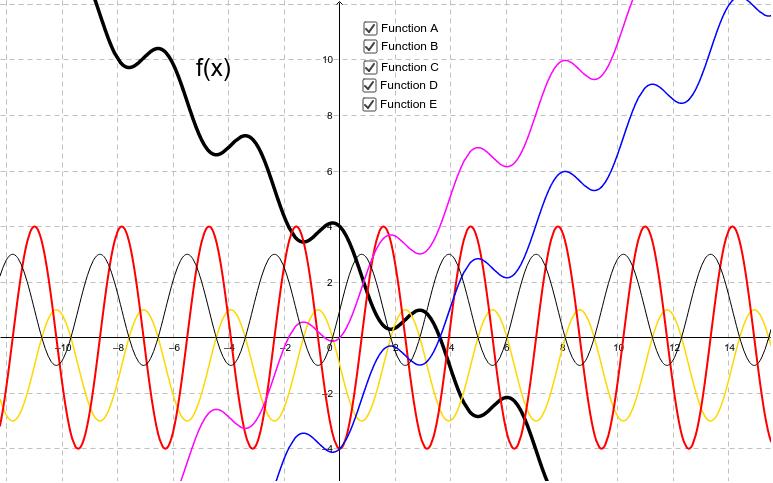
This example demonstrates how to plot functions and their derivatives using GeoGebra and identify the graphical characteristics of derivatives. It involves core math concepts like derivatives, cubic functions, statistical characteristics, arithmetic mean, plane figures, and continuity. The construction uses GeoGebra commands/objects: f (function), f' (first derivative), f'' (second derivative), g (auxiliary function), h (auxiliary function), a (parameter), b (parameter), d (parameter), text1 (text), p (point), e (ellipse), c (circle). Suitable for university calculus courses as guided practice.
GeoGebra Commands & Parameters
f(x) = cos(2 * x) - x + 3f'(x) = f'(x)f''(x) = f''(x)g(x) = -f(x)h(x) = 4 - f(x)Boolean a(true)Boolean b(true)Boolean d(true)p(x) = -f'(x)Boolean e(true)Boolean c(true)
AI Drawing Prompt Reference
Plot a function and its first and second derivatives, along with two auxiliary functions, label the values of three parameters, mark the extrema of the function, and add an ellipse and a circle for decoration.
The prompt above was compiled from the original drawing commands and is for reference only.