
ICME Function Loupe II: Visualizing Slope Functions
Loading the math board and drawing, please wait…
In collections
ICME 13, TSG 16: A visual approach to calculus
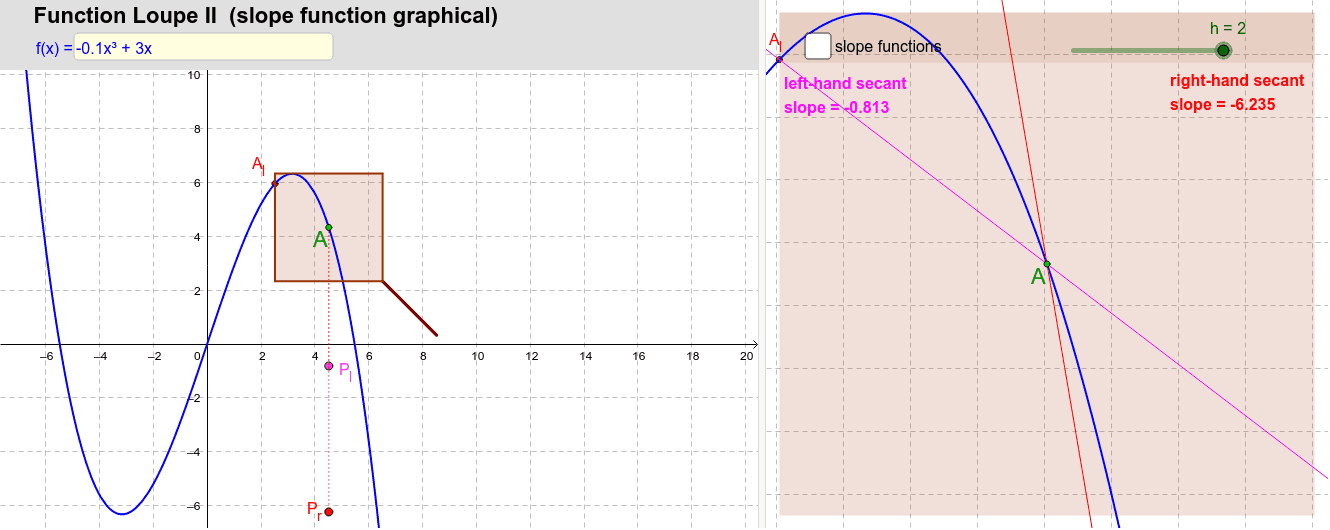
This interactive GeoGebra example demonstrates the concept of the derivative by using a 'loupe' (magnifying glass) to zoom into a function graph around a point, revealing the local slope and dynamically plotting the corresponding slope function. The core mathematical ideas include functions, secant lines, tangent lines, and the limit definition of the derivative. Users can input a custom function via a text field, drag point A, or adjust parameter h to see how the secant slope approaches the tangent slope. The construction employs commands such as Textfield, Point, Segment, Midpoint, Locus, Line, and Polygon to build the loupe interface and generate the slope function locus. This resource is ideal for high school or introductory college calculus courses, helping students grasp the geometric meaning of derivatives through hands-on exploration and visual feedback.
GeoGebra Commands & Parameters
Textfield(f) → Textfeld1Point(f) → APolygon(A + ((-h), (-h)), A + (h, (-h)), A + (h, h), A + ((-h), h)) → Lupe, i, j, k, lMidpoint(A_l, Al) → BMidpoint(A, Ar) → CSegment(A_l, Al) → bSegment(A + (h, (-h)), A + (2 * (h, (-h)))) → griff1Segment(A + (min, (-min)), A + (2 * (min, (-min)))) → griff2If(h > min, griff1, griff2) → griffLocus(P_l, A) → Sekantensteigung_lLocus(P_r, A) → Sekantensteigung_rPolygon(F, G, D, E) → Vieleck4, f_2, g_2, d_2, e_2Line(A_l, A) → sek_lLine(A, A_r) → sek_rSegment(A, P_l) → aPoint(a) → HSegment(H, P_r) → c
AI Drawing Prompt Reference
Draw a function graph where users can input a custom function. Use a magnifying glass (a quadrilateral) around point A to zoom into a local area and show the local slope. Adjust parameter h to see how the slope of the secant line approaches the slope of the tangent line. Draw secant and tangent lines, and their intersections with the function graph. Dynamically plot the locus of secant slopes to form the graph of the slope function.
The prompt above was compiled from the original drawing commands and is for reference only.