
Hypothesis Testing: GeoGebra Example
Loading the math board and drawing, please wait…
In collections
Pearson Maths A level Further Statistics 1
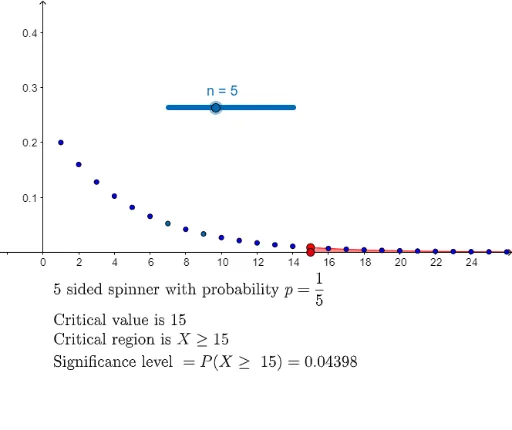
This example demonstrates the application of hypothesis testing in mathematics, visualizing statistical inference processes through graphical methods. Key math concepts include probability & statistics, function graphing, and geometric construction. GeoGebra commands like FractionText, Integral, Sum, If, Segment are used in construction. Suitable for high school students and educators for teaching demonstrations and concept understanding.
GeoGebra Commands & Parameters
FractionText(p_1) → n_{1}Integral(gr, -40, (X + 1 / 2 - n) / sqrt(n)) → IrSum(C2:C5) → D5_1Sum($C2:C5) → D5_2Sum(C2:C5) → D5_3If(D2 < 0.05, A2, D7 < 0.05, A7, D8 < 0.05, A8, D9 < 0.05, A9, D10 < 0.05, A10, D11 < 0.05, A11, D3 < 0.05, D12 < 0.05, A12, D13 < 0.05, A13, D14 < 0.05, A14, D15 < 0.05, A15, D16 < 0.05, A16, A3, D17 < 0.05, A17, D18 < 0.05, A18, D19 < 0.05, A19, D20 < 0.05, A20, D21 < 0.05, A21, D4 < 0.05, D22 < 0.05, A22, D23 < 0.05, A23, D24 < 0.05, A24, D25 < 0.05, A25, D26 < 0.05, A26, A4, D27 < 0.05, A27, D28 < 0.05, A28, D29 < 0.05, A29, D30 < 0.05, A30, D31 < 0.05, A31, D5 < 0.05, D32 < 0.05, A32, A5, D6 < 0.05, A6) → aIf(D2 < 0.05, C2, D7 < 0.05, C7, D8 < 0.05, C8, D9 < 0.05, C9, D10 < 0.05, C10, D11 < 0.05, C11, D3 < 0.05, D12 < 0.05, C12, D13 < 0.05, C13, D14 < 0.05, C14, D15 < 0.05, C15, D16 < 0.05, C16, C3, D17 < 0.05, C17, D18 < 0.05, C18, D19 < 0.05, C19, D20 < 0.05, C20, D21 < 0.05, C21, D4 < 0.05, D22 < 0.05, C22, D23 < 0.05, C23, D24 < 0.05, C24, D25 < 0.05, C25, D26 < 0.05, C26, C4, D27 < 0.05, C27, D28 < 0.05, C28, D29 < 0.05, C29, D30 < 0.05, C30, D31 < 0.05, C31, D5 < 0.05, D32 < 0.05, C32, C5, D6 < 0.05, C6) → bIntegral(gr, -40, a) → numiSegment(A, B) → gIf(D2 < 0.05, D2, D7 < 0.05, D7, D8 < 0.05, D8, D9 < 0.05, D9, D10 < 0.05, D10, D11 < 0.05, D11, D3 < 0.05, D12 < 0.05, D12, D13 < 0.05, D13, D14 < 0.05, D14, D15 < 0.05, D15, D16 < 0.05, D16, D3, D17 < 0.05, D17, D18 < 0.05, D18, D19 < 0.05, D19, D20 < 0.05, D20, D21 < 0.05, D21, D4 < 0.05, D22 < 0.05, D22, D23 < 0.05, D23, D24 < 0.05, D24, D25 < 0.05, D25, D26 < 0.05, D26, D4, D27 < 0.05, D27, D28 < 0.05, D28, D29 < 0.05, D29, D30 < 0.05, D30, D31 < 0.05, D31, D5 < 0.05, D32 < 0.05, D32, D5, D6 < 0.05, D6) → cIntegral((1 / n * (1 - 1 / n)^(x - 1)), a, 50) → m_{2}
AI Drawing Prompt Reference
Create a statistical graph for hypothesis testing, including a probability density function curve and an integral area under the curve from -40 to a certain point. Use conditional statements to shade the area under the curve based on probability values, indicating the rejection region at the significance level. Draw a line segment connecting two key points A and B.
The prompt above was compiled from the original drawing commands and is for reference only.