
Hypergeometric Distribution Probability Calculation
Loading the math board and drawing, please wait…
In collections
Learn GeoGebra Classic
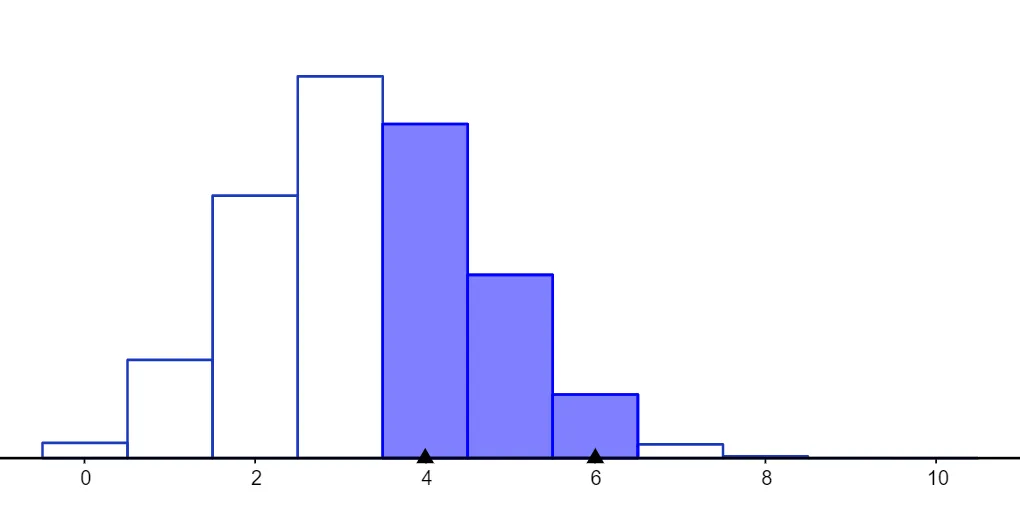
This example demonstrates how to calculate probabilities of a hypergeometric distribution. Through interactive operations, users can intuitively understand the properties and calculation methods of the hypergeometric distribution. The core mathematical concepts involved include probability theory, statistical distributions, and combinatorial mathematics. The construction highlights the use of GeoGebra commands Min, Max and objects a, b, c, d to dynamically adjust distribution parameters and compute probabilities. Suitable for high school students and above to learn and understand the hypergeometric distribution in probability and statistics.
GeoGebra Commands & Parameters
Min(x(Point[xAxis]) + 1.5, x(Point[xAxis]) + 1.5) →Max(x(Point[xAxis]) + 1.5, x(Point[xAxis]) + 1.5) →
AI Drawing Prompt Reference
Create a hypergeometric distribution probability calculation graph with four adjustable sliders a, b, c, and d to set the distribution parameters. Use Min and Max functions to dynamically adjust the x-axis point positions, illustrating the hypergeometric distribution probability calculation process.
The prompt above was compiled from the original drawing commands and is for reference only.