
Hyperbolic tanh & coth Graphs
Loading the math board and drawing, please wait…
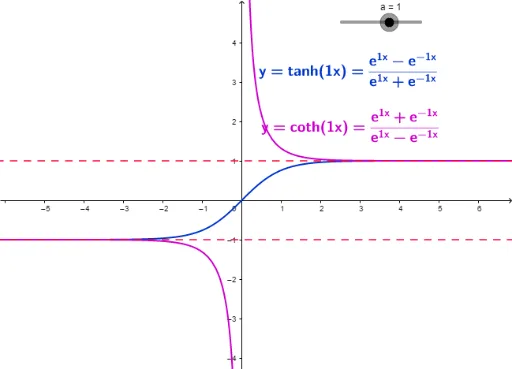
This example demonstrates the graphs of tanh(ax) and coth(ax) and how the parameter 'a' affects their shapes. Key math concepts include hyperbolic functions, graph transformations, and the impact of parameters on function graphs. Constructed using GeoGebra commands like sliders (a), function objects (g, f, h), text objects (text1, text2), and auxiliary objects (b, c, r). Ideal for high school students learning about function graph transformations and parameter effects, as well as understanding limits in calculus.
GeoGebra Commands & Parameters
Numeric a(1)g(x) = (-exp((-((a * x)))))f(x) = exp((a * x))h(x) = f(x) + g(x)p(x) = f(x) - g(x)q(x) = tanh((a * x))Line b(0, 1, -1)Line c(0, 1)r(x) = 1 / tanh((a * x))
AI Drawing Prompt Reference
Plot the graphs of hyperbolic tangent and cotangent functions, showing how the parameter a affects their shapes. First, draw two horizontal lines at y=1 and y=-1. Then, plot the hyperbolic tangent function tanh(ax) and the hyperbolic cotangent function coth(ax) based on the value of parameter a, highlighting their intersections with the horizontal lines. Finally, overlay the graphs of tanh(ax) and coth(ax) on the same coordinate system to observe the changes in their shapes as parameter a varies.
The prompt above was compiled from the original drawing commands and is for reference only.