
Hyperbola and Geometric Transformations
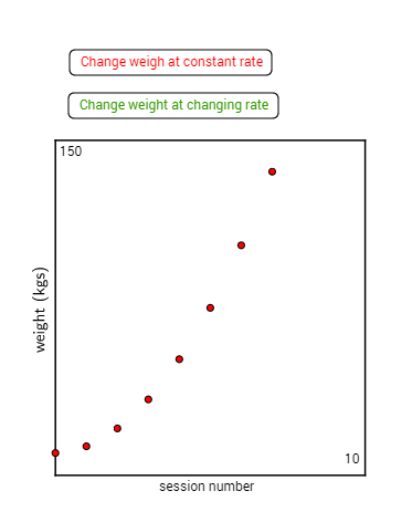
Loading the math board and drawing, please wait…
This example demonstrates the geometric properties and symmetry of hyperbolas. It involves core math concepts like hyperbolas, geometric transformations, polynomial functions, and histograms. Construction highlights include using commands such as Polygon, RotateText, Textfield, Sequence, and TableText to create polygons, texts, sequences, and tables. Suitable for high school mathematics teaching to understand analytical geometry and function graphs.
GeoGebra Commands & Parameters
Polygon((0, 0), (0, 150), (10, 150), (10, 0)) → poly1, f, g, h, iRotateText("weight (kgs)", 90°) → text3Textfield(step) → InputBox1Textfield(first_1) → InputBox2Textfield(change) → InputBox3Sequence((i, first_1 + (change * i)), i, 0, 10) → list1Sequence(Segment[(i, (change * i) + first_1), (i + 1, (change * i) + first_1)], i, 0, 9) → list2Sequence(Segment[(i + 1, (change * i) + first_1), (i + 1, (change * (i + 1)) + first_1)], i, 0, 9) → list3Textfield(first) → InputBox4Textfield(change1) → InputBox5Textfield(change2) → InputBox6Sequence(change1 + (change2 * (i - 1)), i, 1, 10) → list5Sequence(first + change1 + (change2 * (i - 1)) + (change2 * i), i, 0, 10) → list6TableText({{sn, w_1, c_1}, {1, first_1 + change, change}, {2, first_1 + (change * 2), change}, {3, first_1 + (change * 3), change}, {4, first_1 + (change * 4), change}, {5, first_1 + (change * 5), change}, {6, first_1 + (change * 6), change}, {7, first_1 + (change * 7), change}, {8, first_1 + (change * 8), change}, {9, first_1 + (change * 9), change}, {10, first_1 + (change * 10), change}}, "|_r") → text6TableText({{sn, w_1, c_1, c_2}, {A2, B2, C2, D2}, {A3, B3, C3, D3}, {A4, B4, C4, D4}, {A5, B5, C5, D5}, {A6, B6, C6, D6}, {A7, B7, C7, D7}, {A8, B8, C8, D8}, {A9, B9, C9, D9}}, "|_r") → text5
AI Drawing Prompt Reference
Draw a hyperbola in the coordinate system and perform geometric transformations around it. First, draw a rectangle, then create a rotated text label indicating weight. Next, input starting and changing values to generate a series of points and line segments, forming a tilted line. Finally, create a table listing these point sequences.
The prompt above was compiled from the original drawing commands and is for reference only.