
How Changing the Y-Intercept Affects a Linear Relation
Loading the math board and drawing, please wait…
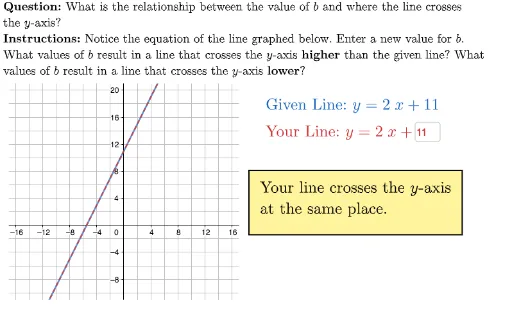
This example demonstrates how adjusting the y-intercept alters the position of a line in the coordinate system. It involves core math concepts like linear equations, slope, y-intercept, and coordinate geometry. Constructed using GeoGebra commands/objects such as Textfield, LaTeX, If, Polygon. Suitable for middle school and above learners to visually understand the properties of linear functions and the impact of parameter changes.
GeoGebra Commands & Parameters
Textfield(textUserB) → ansBoxUserBLaTeX(("\text{Given Line: }y=" * givenLine)) → givenLineLabelIf(numUserB > givenB, "crosses the \(y\)-axis\\higher", If[numUserB < givenB, "crosses the \(y\)-axis\\lower", If[numUserB ≟ givenB, "crosses the \(y\)-axis\\at the same place", "is invalid"]]) → resultLaTeX((("\fcolorbox{black}{#fff59d}{\text{Your line " * result) * ".}}")) → feedbackLaTeX(("\text{Your Line: }y=" * givenLine)) → userLineLabelLaTeX("\text{\textbf{Question: }What is the relationship between the value of \(b\) and where the line crosses\\the \(y\)-axis?\\\textbf{Instructions: }Notice the equation of the line graphed below. Enter a new value for \(b\).\\What values of \(b\) result in a line that crosses the \(y\)-axis \textbf{higher} than the given line? What\\values of \(b\) result in a line that crosses the \(y\)-axis \textbf{lower}?}") → TEXTPolygon((-17, -11), (-17, 21), (17, 21), (17, -11)) → viewBox, f, g, h, i